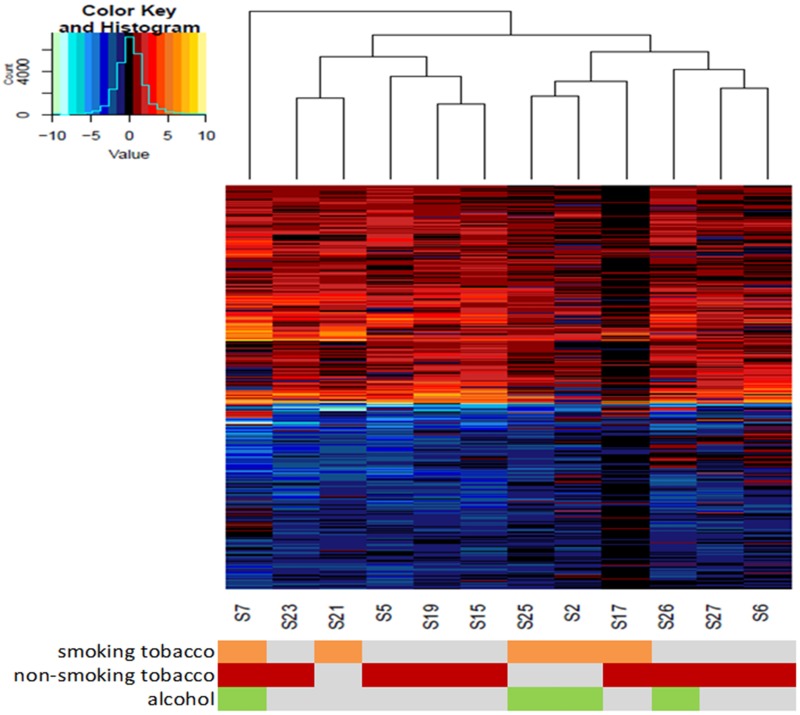
Fig 1. Hierarchical clustering of GBSCC tumours by 2176 deregulated gene expressions.
Hierarchical clusters were constructed based on log2 transformed expression values of 1002 upregulated (represented by colours of negative values in heatmap) and 1174 downregulated genes (represented by colours of positive values in heatmap). Across all 12 tumours there is a gross similarity in deregulation pattern, with some exceptions. As a result, 3 distinct sample clusters were noticed. The coloured panel below, represent subject's smoking (orange) and/or chewing tobacco (red) and/or alcohol abuse (green)status.

