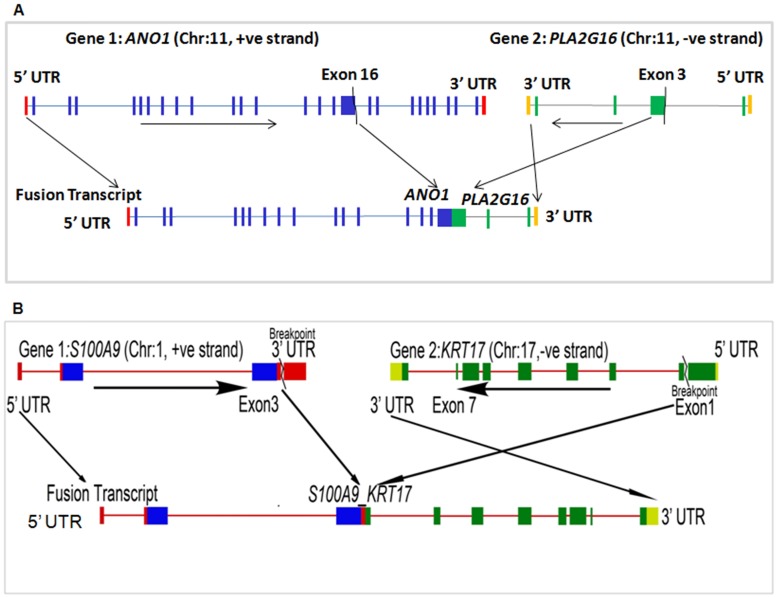
Fig 4. Schematic view of fusion events.
(A) ANO1-PLA2G16 fusion gene which retains exon 16 along with upstream exons of ANO1 and exon 3 along with downstream exons of PLA2G16 in tumour tissue (i.e. 23D) of the tumour-normal paired S23 sample. (B) S100A9-KRT17 fusion gene deduced from coding regions up to exon 3 of S100A9 and exon 1 to all other downstream exons of KRT17 in tumour tissue (i.e. 2D) of the tumour-normal paired S2 sample.

