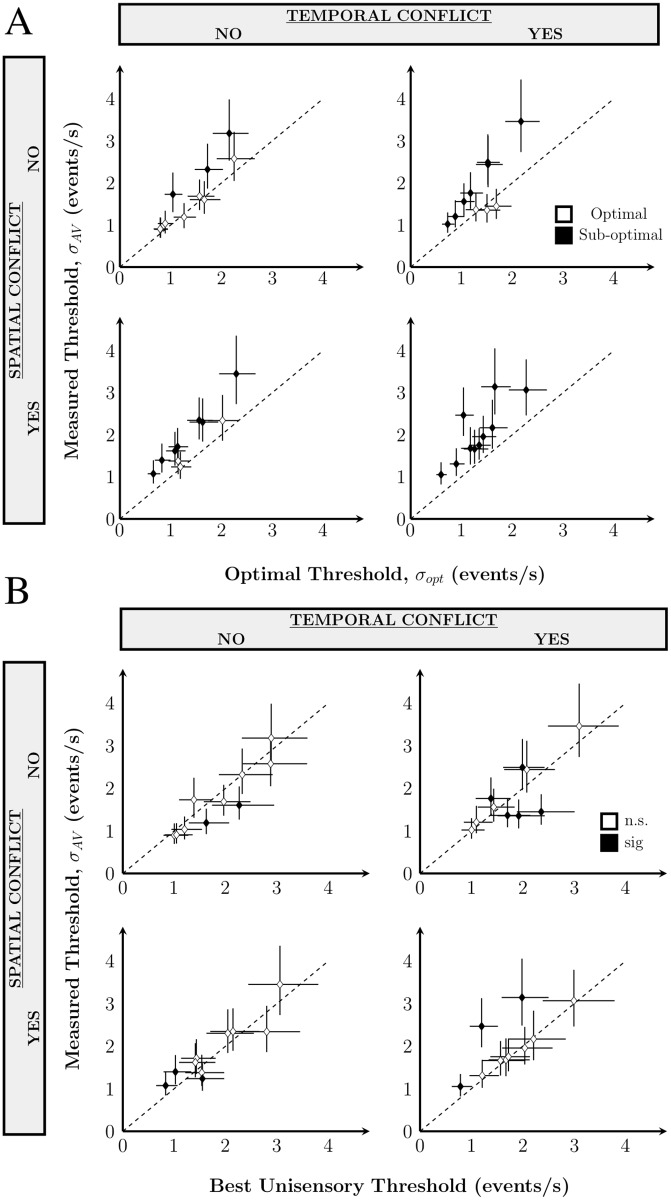
Fig 5. Thresholds in Exp 1.
A: Measured multisensory threshold as a function of the threshold predicted for optimal integration based on the unisensory thresholds for each observer in each condition. Data points above the line (black) indicate that threshold was sub-optimal, whereas points along the equality line (white) indicate optimal integration. B: A comparison of measured thresholds with the best unisensory threshold. Points not along the equality line (black) indicate that the best-cue strategy was not used. Below the equality line indicates a multisensory enhancement effect and points above suggest poor cue selection strategy (i.e. using the less informative unisensory cue). Error bars: 95% CI.

