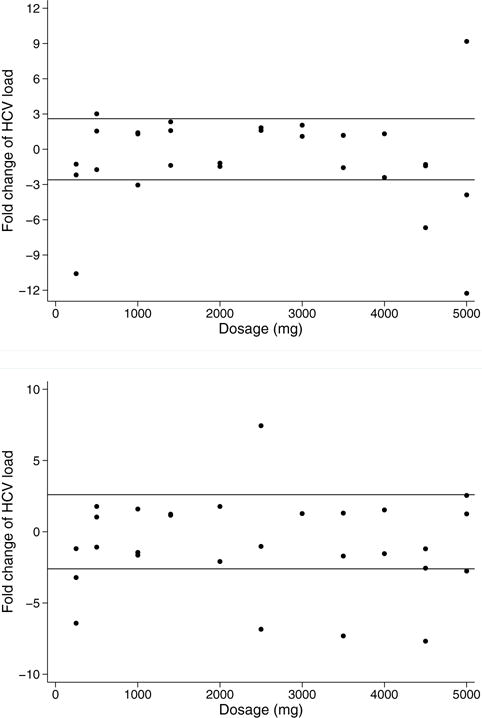
Figure 2.

(A) Viral load change (Week 2). Fold change in HCV load (week 2 compared with baseline) by dose. Reference lines: ±2.6 fold (±0.41-log). (B) Viral load change (Week 4). Fold change in HCV load (week 4 compared with baseline) by dose. Reference lines: ±2.6 fold (±0.41-log). This figure is available in colour online at wileyonlinelibrary.com/journal/ptr.
