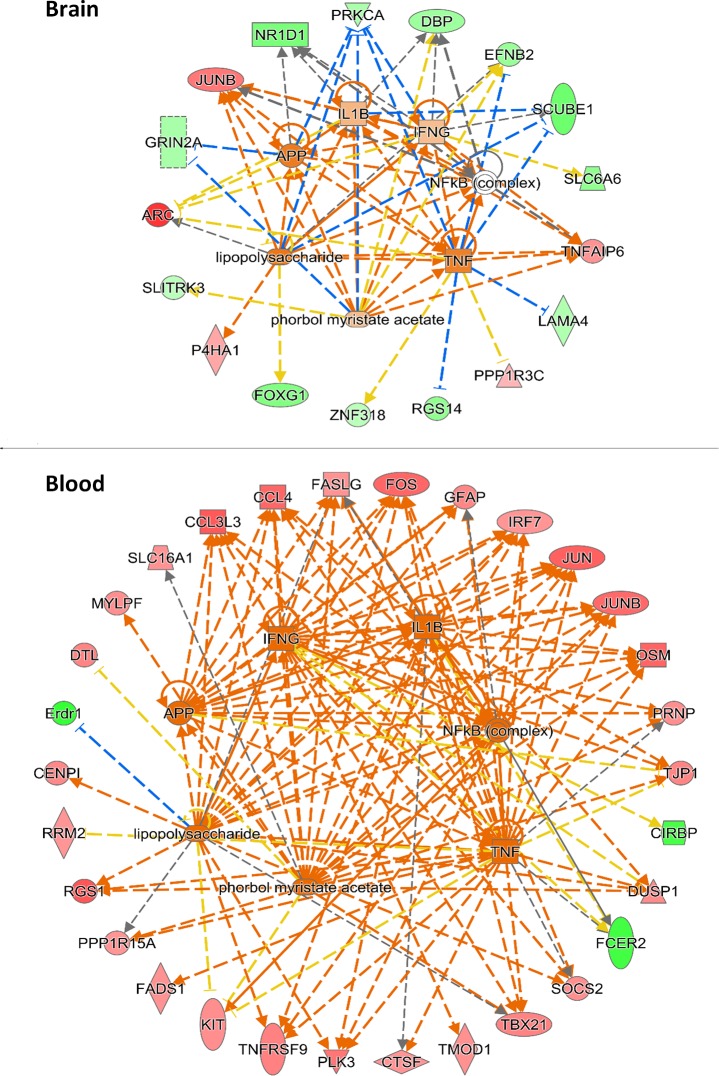
Fig 4. Predicted effects of upstream regulators on the levels of differentially expressed genes in brain and blood of Slc1a1+/- mice.
IPA software was used to indicate the direction of change and relatedness of the common upstream regulators (n = 7) of the differentially expressed genes in the brain and blood of Slc1a1-HET mice. Genes that were changed in expression are shown in the perimeter of each diagram. Genes with significantly increased expression are colored in red and genes with significantly decreased expression are colored in green. The predicted upstream regulators are shown in the center. Orange dashed lines indicate predicted positive effects that are consistent with the observed changes in expression. Blue dashed lines indicate predicted negative effects that are consistent with the observed changes. Yellow dashed lines denote inconsistent predicted and observed effects.

