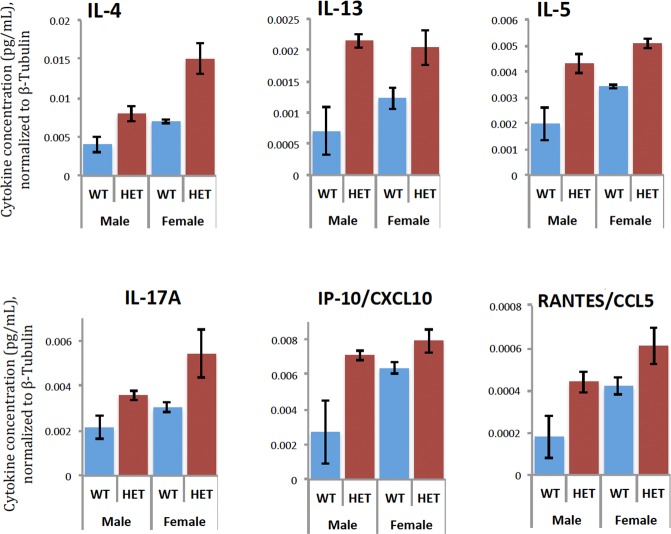
Fig 7. Cytokines with different concentrations in Slc1a1-HET vs. WT mouse brains.
Cytokine profiling assay was performed in the brains of a subset of the same Slc1a1-HET and WT mice used for behavioral phenotyping and morphometry (n = 4 males and 4 females per genotype, n = 16 total). To control for different amounts of total protein in the lysates, we normalized all of the cytokine concentrations to the levels of beta-tubulin in each sample. Comparisons between the groups were performed using a 2-way ANOVA (Sex x Genotype) with FDR correction of Genotype main effect p values and a Scheffé post-hoc test used to control for possible non-normality of the ratio data. Only those cytokines surviving FDR correction (q<0.25) are shown. WT, wildtype; HET, Slc1a1-heterozygous.

