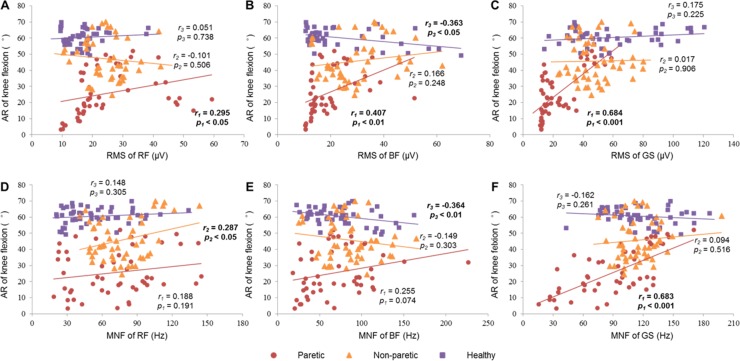
Fig 6. Correlations between muscle activation and angle range (AR) during knee flexion.
(A)-(C): Correlations between the RMSs of RF (A), BF (B), GS (C) and AR. (D)-(F): Correlations between the MNFs of RF (D), BF (E), GS (F) and AR. The r1, r2 and r3 are the correlation coefficients of the paretic, non-paretic and control groups, respectively. The p1, p2 and p3 indicate the significance of the paretic, non-paretic and control groups, respectively.

