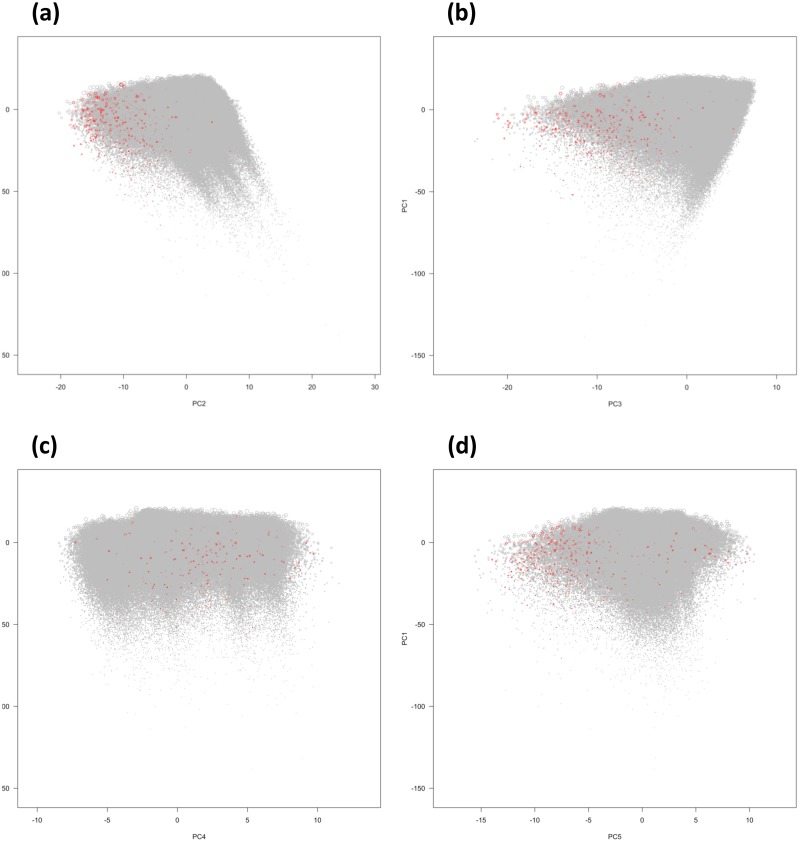
Fig 3. The distributions of those dying in the second years of the MEPS panels by principal components.
(a) The distribution of those dying by first and second principal components (PC1 and PC2). (b) The distribution of those dying by first and third principal components (PC1 and PC3). (c) The distribution of those dying by first and fourth principal components (PC1 and PC4). (d) The distribution of those dying by first and fifth principal components (PC1 and PC5). Note: red circles: those dying in the second years of the MEPS panels; gray circles: those surviving throughout the MEPS panels.

