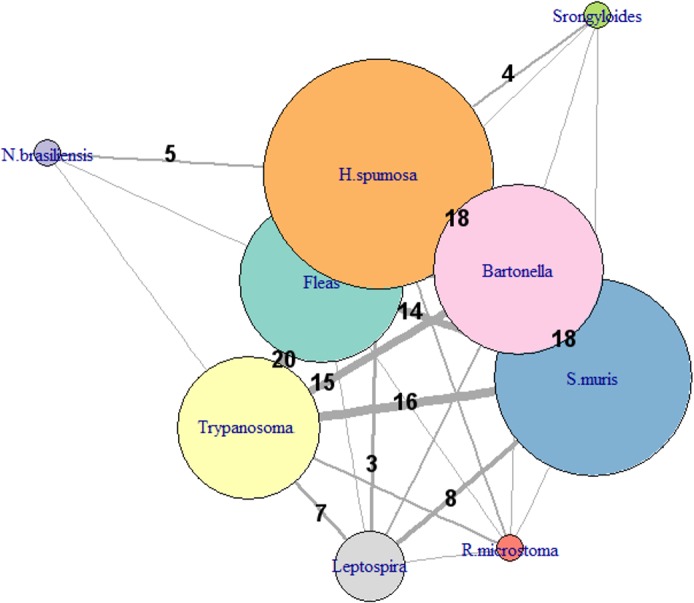
Fig 6. Graphical representation of the structuring of the main parasites of the brown rats from Chanteraines using the network approach.

The edge width is proportional to the number of individual hosts involved (numbers correspond to the number of rats sharing the parasites). The node size is proportional to the number of hosts infected (prevalence).
