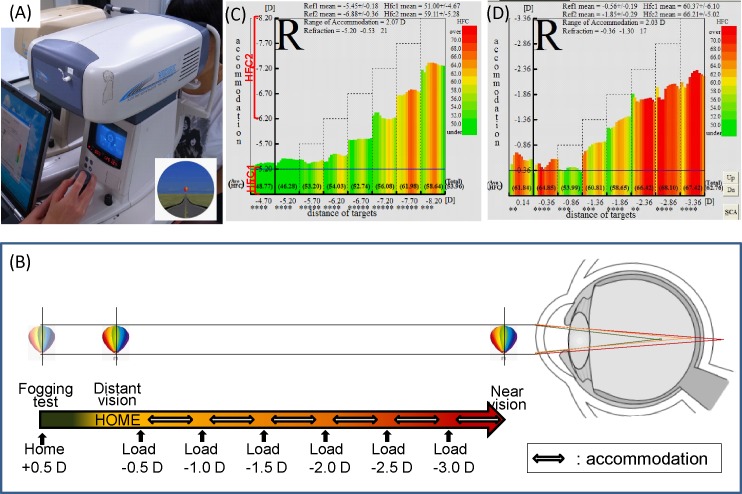
Fig 1. Measurement system of dynamic auto-refractometer.
(A) Dynamic auto-refractometer (AA-2TM) device. (B) Measurement system: accommodative microfluctuations are measured while focusing on an out-of-focus image at each predetermined distance. (C) Normal pattern of frequency of kinetic reaction map: the graph appears in green and green-yellow-red bars with low and high accommodation, respectively, that represents low HFC1 and relatively low HFC2 values. (D) Accommodative excess pattern of frequency of kinetic reaction map: the graph appears in red bars with low and high accommodation that represents high HFC1and HFC2 values, respectively.

