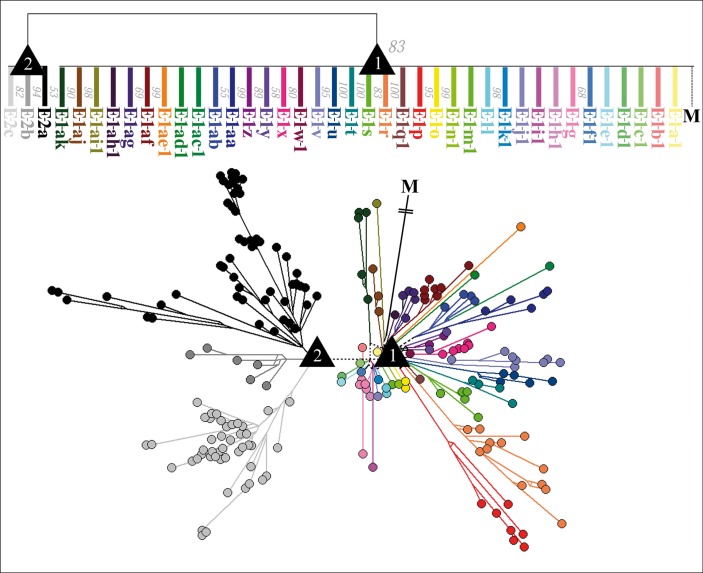
Fig 1. Consensus Maximum Likelihood tree and Median-joining network (transition/transversion bias = 4) of the E genogroup.
The upper and the lower phylogeny show the phylogenetic relationship between E haplotypes of IHNV, based on the complete G gene sequence and were generated using 294 E isolates. The upper phylogeny is illustrated as a Consensus Maximum Likelihood tree (conflicting branching patterns are resolved by selecting the pattern seen in more than 50% of the trees). Numbers to the right of the branches represent the bootstrap support values obtained from 250 replicates. The lower phylogeny is illustrated as a Median-joining network. The subordinated lineages of clade E–1 (E–1–a to E–1–a–k) and E–2 (E–2–a to E–1–c) are indicated using a color code. Black triangles marked “1”or “2” represent nodes (node 1 and node 2) that correspond in the Median-joining network with a polytomy. Isolate M is the outgroup in each diagram.

