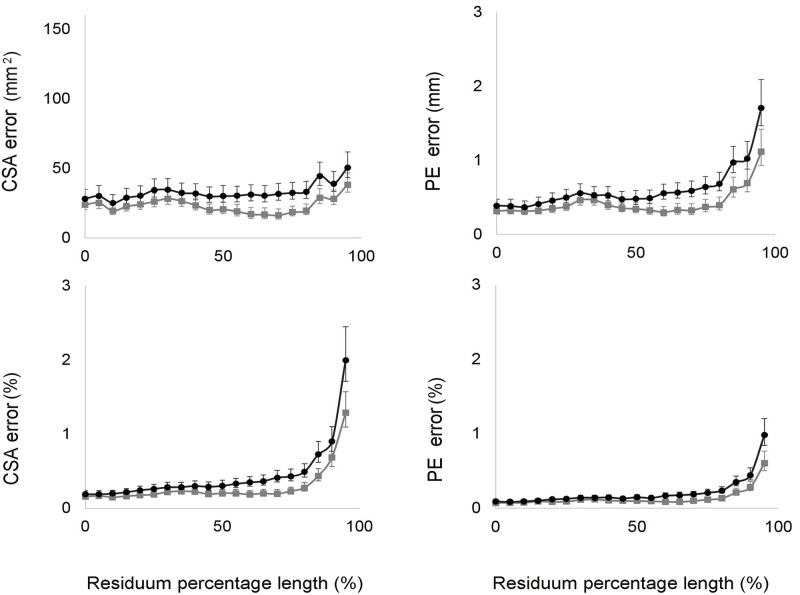
Fig 5. Residual limb shape reliability results.
The graphs represent the TEMs and the lower and upper CL for CSAs and PE calculated for each section along the residual limb model, and expressed in absolute units and as percentage of the Romer scanner’s original measure. Grey lines indicate intra-reliability results. Black lines indicate inter-reliability results (0% indicates the first proximal section of the residual limb model).

