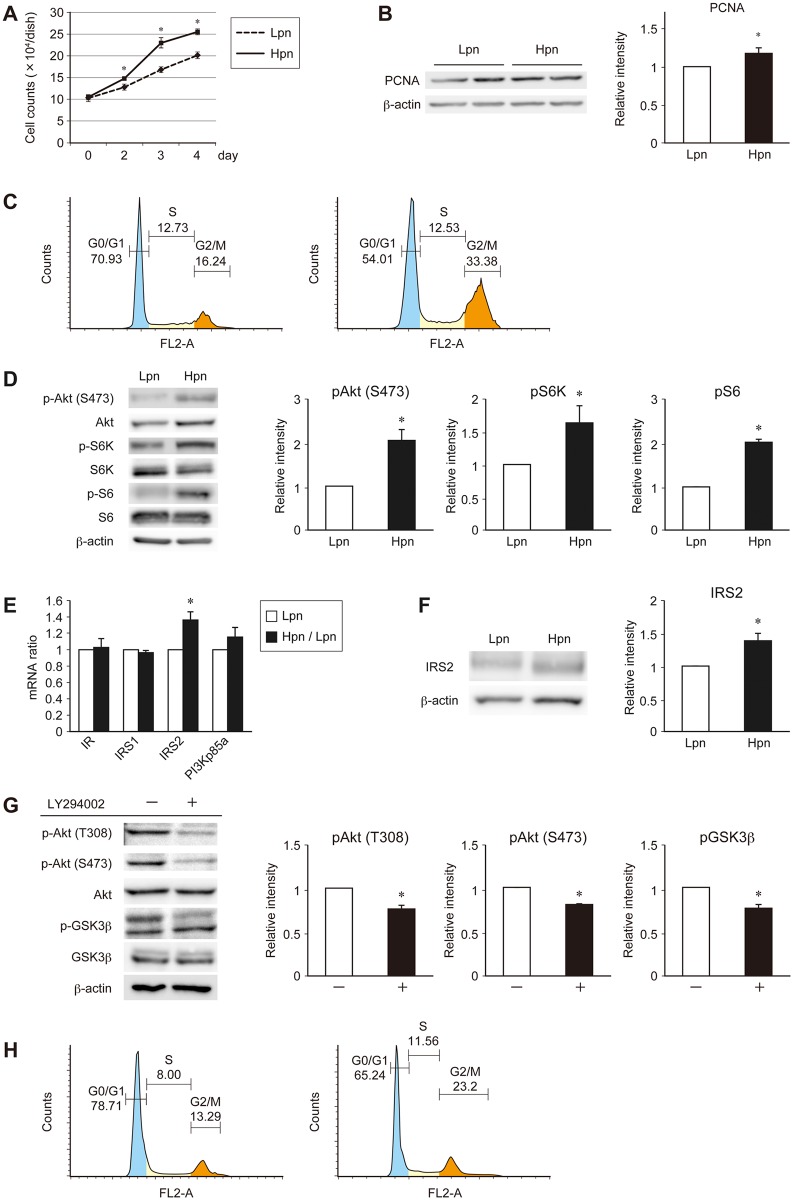
Fig 1. Analysis of the proliferation potency of MIN6 cells at different passage frequencies.
(A) Proliferation data comparing Lpn (dotted line) and Hpn (straight line) MIN6 cells. (B, D) Immunoblot analysis of PCNA (B) and insulin signaling proteins (D) in Lpn and Hpn MIN6 cells. Representative (left) and quantitative (right) data are shown. (C) Representative cell cycle analysis in Lpn (left) and Hpn (right) MIN6 cells. (E) Quantitative real-time PCR analysis of insulin signaling molecule mRNA expression in Lpn (white bars) and Hpn (black bars) MIN6 cells. (F) Immunoblot analysis of IRS2 in Lpn and Hpn MIN6 cells. Representative (left) and quantitative (right) data are shown. (G, H) Representative (left) and quantitative (right) immunoblot analysis of insulin signaling proteins (G) and representative cell cycle analysis (H) in Hpn cells with or without LY294002. Data are represented as the mean ± SEM for 4 (A), and 5 (B–G) independent experiments. *P < 0.05.

