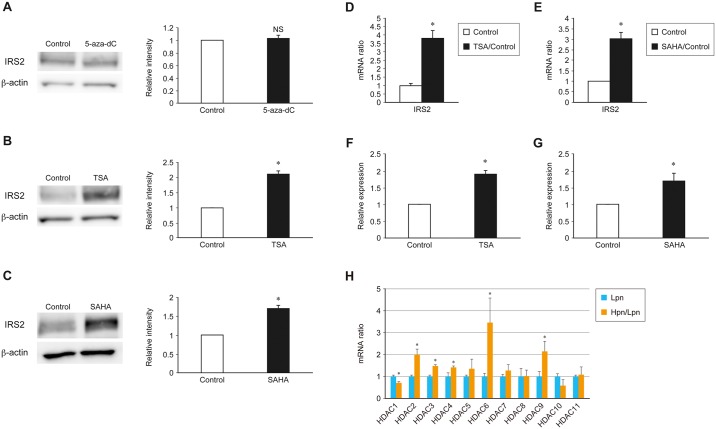
Fig 3. Effects of specific HDAC inhibitors on the expression of IRS2 in MIN6 cells.
(A–C) Immunoblot analysis of IRS2 in MIN6 cells treated with the DNA methylation inhibitor 5-aza-dC (A) or the class I and class II HDAC inhibitors TSA (B) and SAHA (C). Representative (left) and quantitative (right) data are shown. (D, E) Quantitative real-time PCR analysis of Irs2 mRNA expression in control MIN6 cells (white bars) and those treated with TSA (D) or SAHA (E) (black bars). (F, G) ChIP-qPCR of H3K9/14 histone acetylation of the Irs2 promoter region in MIN6 cells with TSA (F) or SAHA (G). (H) Quantitative real-time PCR analysis of HDAC isoforms in Lpn and Hpn MIN6 cells. Data are represented as the mean ± SEM for 5 (A–H) independent experiments. *P < 0.05.

