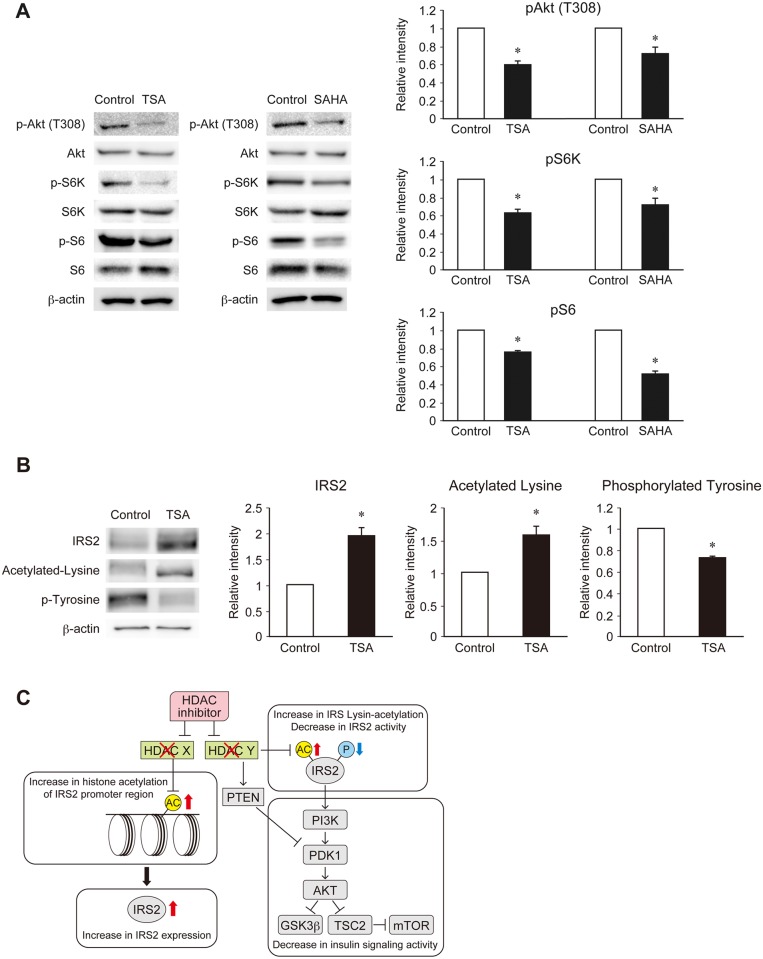
Fig 4. Effects of specific HDAC inhibitors on insulin signaling through IRS2 lysine acetylation in MIN6 cells.
(A) Immunoblot analysis of insulin signaling proteins in MIN6 cells treated with TSA or SAHA. Representative (left) and quantitative (right) data are shown. (B) Immunoblot analysis of IRS2, acetylated lysine, and phosphorylated tyrosine in MIN6 cells treated with TSA after protein interaction analysis using antibodies to IRS2. Representative (left) and quantitative (right) data are shown. (C) Proposed model of HDAC regulation of IRS2 expression and activity in β cells. Data are represented as the mean ± SEM for 5 (A, B) independent experiments. *P < 0.05.

