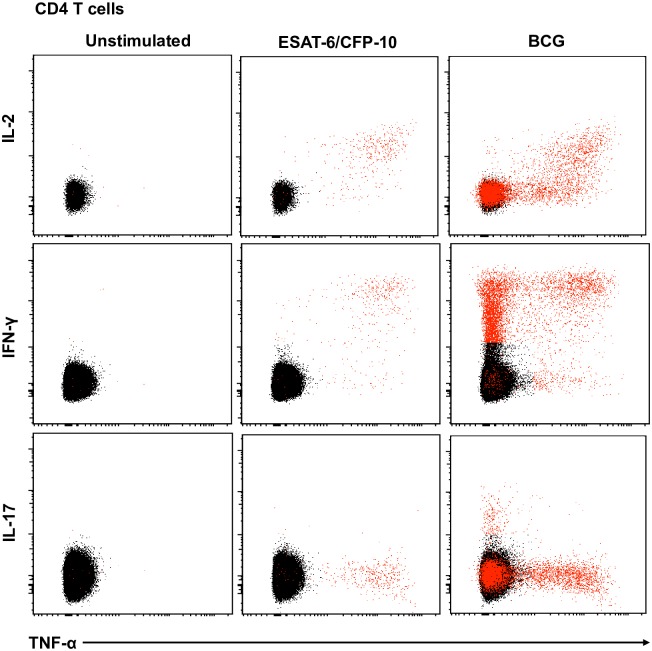
Fig 5. Representative flow cytometry plots of cytokine expression by CD4 T cells.
CD4 T cells expressing IFN-γ, IL-2, TNF-α and/or IL-17 upon stimulation with BCG or ESAT-6/CFP-10 peptide pools for 12 hours, compared to an unstimulated control sample. The plots represent cytokine-positive cells (red) overlayed onto the background of the entire CD4 T cell parent population (black). Similar assessment was also performed for CD8 and γδ T cells (data not shown).

