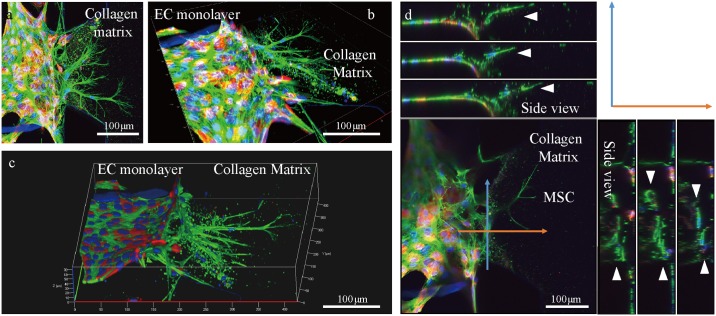
Fig 4. 3D confocal images of MSCs migrating transendothelially.
(a-c) Red fluorescence shows the cytosol of RFP-tagged EC. Green fluorescence shows actin fibers of both MSCs and ECs. Cells without red fluorescence are MSCs. Blue are nuclei of the cells stained with DAPI. (d) Ortho view of transendothelial migration of MSCs. Blue and orange arrows indicate the side view range of the directions of movement. White arrows indicate the locations of nuclei of migrating MSCs.

