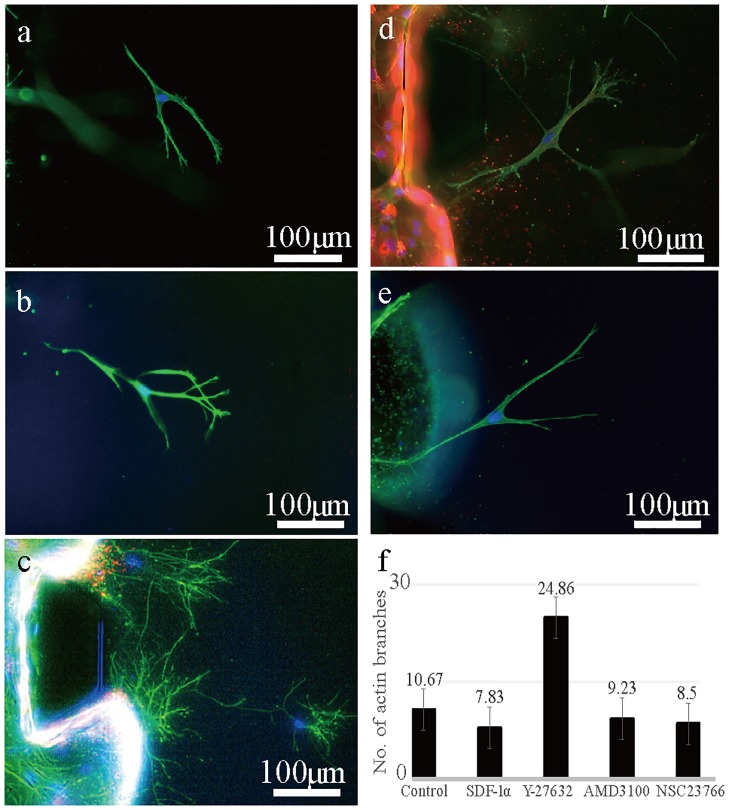
Fig 7. Morphology of F-actin-stained MSCs under different conditions (branch counting).
(a) Morphology of MSCs without SDF-1α gradient. (b) Morphology of MSCs under the gradient of SDF-1α. (c) Morphology of MSCs under Y-27632 treatment (d) Morphology of MSCs under AMD3100 treatment (e) Morphology of MSCs under NSC23766 treatment (f) An average number of actin branches of MSCs counted with Image J. One-way ANOVA analysis was used for branch counting. *p<0.05 represents at least one group has inequality.

