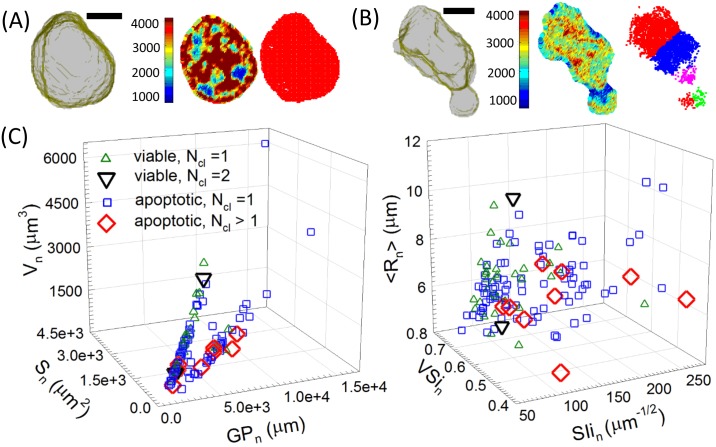
Fig 4. Two cases of clustering analysis on nuclear voxels of one.
(A) viable MCF-7 cell with Ncl = 1 (see Visualization 1); (B) apoptotic one with Ncl = 5 (see Visualization 2): 3D perspective view of nucleus (left), false-color image slice #18 before (middle) and after (right) binary conversion, bar = 5μm; (C) scatter plots of nuclear parameters of cells that allow voxel clustering: V = volume, S = surface area, GP =(number of nuclear membrane voxels)·(voxel side length), SIi = GP/V1/2, VSi = 4πR2/S with R = (3V/4π)1/3.

