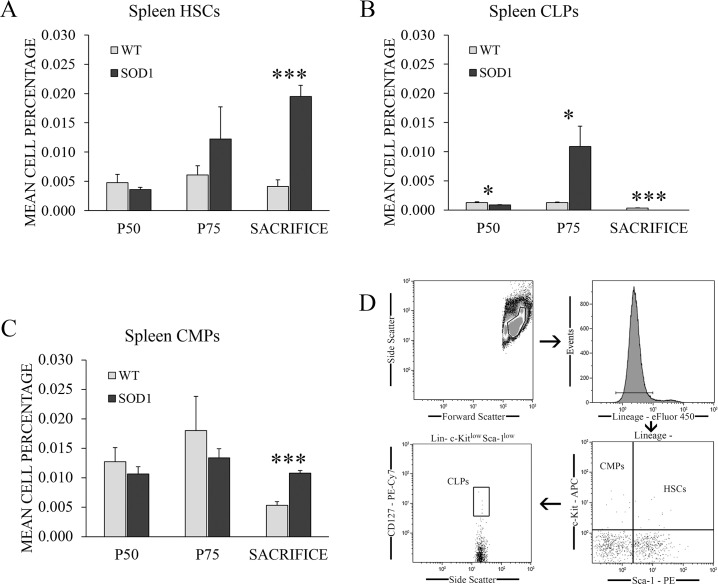
Fig 1. HSPCs percentages recorded by flow cytometry in the spleen of WT and transgenic SOD1G93A mice.
(A) HSC, (B) CLP and (C) CMP percentages were measured by flow cytometry in the spleen of transgenic SOD1G93A mice (black bars) at the main stages of the disease: asymptomatic stage (P50), symptomatic stage (P75) and terminal stage (sacrifice). WT litter mates (light grey bars) were used as controls. The gating strategy of the flow cytometry analysis is shown in (D). y-axis represents the mean cell percentage for each cell type, and x-axis represents the time points selected. Data are represented as means and error bars represent the standard error of the mean (s.e.m.). Statistical significance was established at p-values under 0.05 (*), high statistical significance at p-values under 0.01 (**) and very high statistical significance at p-values under 0.001 (***). n = 12 animals per genotype and time point.

