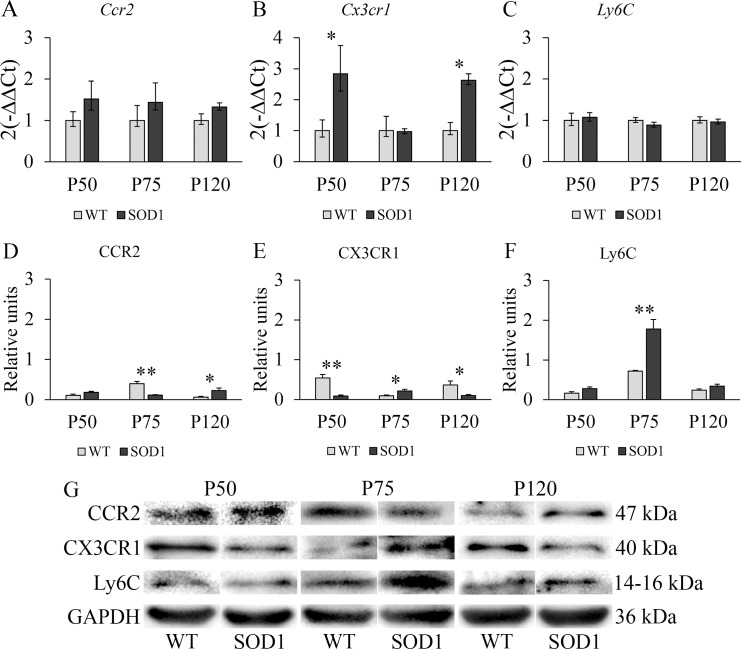
Fig 4. RT-PCR and Western blot study of monocytic markers CCR2, CX3CR1 and Ly6C in the skeletal muscle of WT and transgenic SOD1G93A mice.
(A, B, C) RT-PCR was used to measure mRNA expression levels of Ccr2, expressed in inflammatory monocytes; Cx3cr1, a marker of non-inflammatory monocytes; and Ly6C, expressed in inflammatory monocytes. (D, E, F) Western blot analysis of CCR2, CX3CR1 and Ly6C protein expression levels. y-axis and x-axis represent the gene expression fold change and time points selected for RT-PCR analysis, and protein fold change and time point selected for Western Blot analysis, respectively. Transgenic SOD1G93A mice are represented with black bars and WT litter mates used as controls, with light grey bars. Error bars represent the standard error of the mean (s.e.m.) for the Western blot analysis and error bars for the RT-PCR analysis were calculated using the method developed by Livak et al. [30]. Statistical significance was established at p-values under 0.05 (*) and high statistical significance at p-values under 0.01 (**). n = 12 animals per genotype and time point. (G) Representative protein bands for every protein studied by Western blot in both WT and SOD1G93A mice. GAPDH was used as housekeeping protein for protein normalization.

