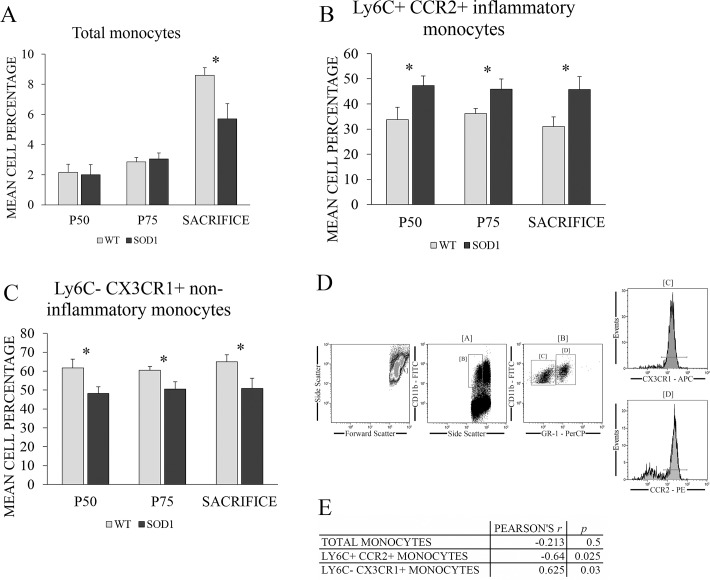
Fig 6. Potential role of monocytes in the survival of transgenic SOD1G93A mice.
(A) Total monocytes, (B) inflammatory and (C) non-inflammatory monocytes percentages were measured by flow cytometry in the blood of WT (light grey bars) and transgenic SOD1G93A mice (black bars) at the main stages of the disease: asymptomatic stage (P50), symptomatic stage (P75) and terminal stage (mice endpoint ranged between 128 and 143 days, depending on the survival of the individual animals). WT litter mates were used as controls. y-axis represents the mean cell percentage for each cell type studied, while x-axis represents the time points selected for blood extraction. The gating strategy of the flow cytometry analysis is shown in (D). Finally, the correlations found between monocyte types and survival is shown in (E). Data are presented as means and error bars represent the standard error of the mean (s.e.m.). Statistical significance was established at p-values under 0.05 (*). n = 12 animals per genotype (extractions were performed serially along time, always using the same mice).

