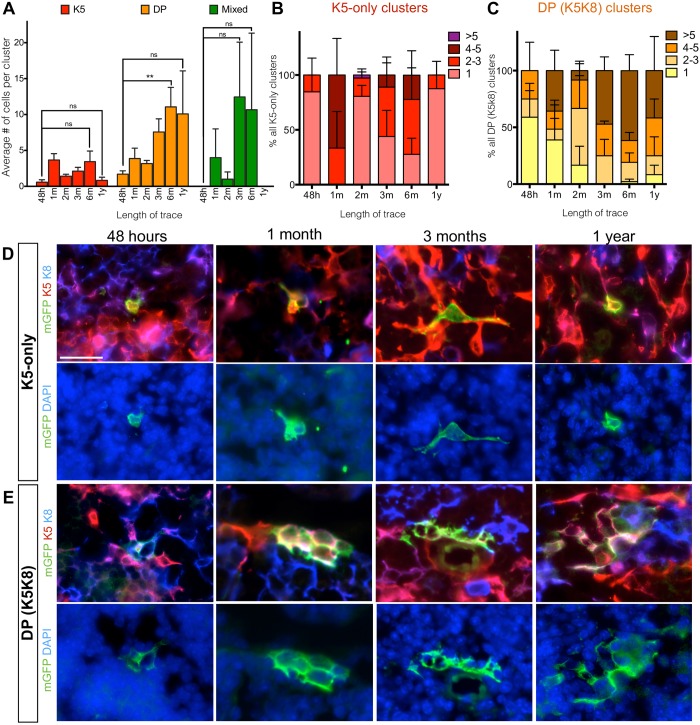
Fig 4. K5-only and DP-only AXCT2-labeled clusters do not expand significantly over time.
(A) The average number of cells per cluster is plotted for K5-only (red), DP-only (yellow) and mixed (green) cluster types at each time point. The differences in average cluster sizes between 48 hour trace and 6 month or 1 year trace are tested for significance. (B and C) The size distribution of K5-only clusters (B) and DP-only clusters (C) at each time point. (D and E) Representative images of mGFP-labeled K5-only clusters (D) and DP-only clusters (E) observed at 48 hours, 1 month, 3 months and 1 year after trace initiation. The left panels show co-staining with mGFP, K5 and the K8, and the right panels show the same clusters with DAPI. Graphs depict averages ± SEM, and two-tailed unpaired Student’s t-test was performed to obtain p values of significance. ns—not significant, ** p<0.01. Scale bars represent 20μm.

