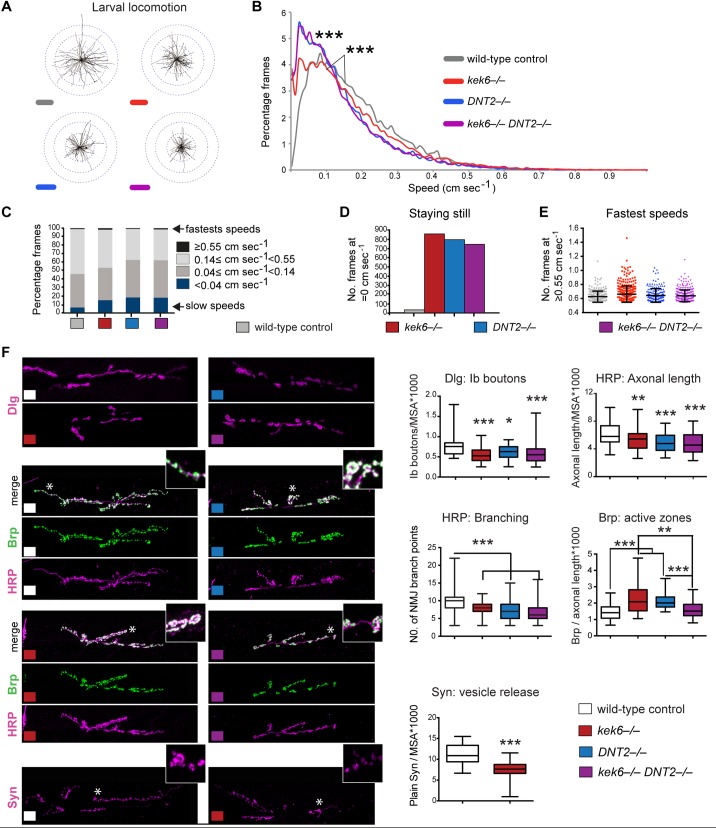
Fig 4. kek6 and DNT2 mutants have smaller NMJs and impaired locomotion.
(A) Plotted trajectories of filmed larvae, and (B) histograms of percentage frames at each speed analysed with FlyTracker. Kruskal-Wallis p<0.0001 and ***p<0.001 post-hoc Dunn test, n≥22344 frames. (C-E) Speed distribution classified into arbitrary categories. (C) Mutants spend more time at the lowest speeds than controls, generally do not crawl at the higher speeds (pale grey, left), but like controls can reach the highest speeds for a small fraction of time. (D) Wild-type larvae are hardly at speed = 0, contrary to the mutants. (E) All genotypes can achieve the highest speeds, but none spend much time crawling at these speeds. (F) NMJs (left, with higher magnification details of areas indicated by asterisks) and box-plot graphs (right) showing: kek-6–/–and DNT2–/–single mutants and kek-6–/–DNT2-/-double mutants have fewer Dlg+ boutons, smaller HRP+ axonal terminals (normalized to muscle area, MSA), and less complex NMJs with reduced axonal branching. Dlg: Kruskal-Wallis p<0.0001, and *p<0.05, **p<0.01, ***p<0.001 post-hoc Dunn; HRP: One Way ANOVA p<0.0001, and **p<0.01, ***p<0.001 post-hoc Dunnett. kek-6 and DNT2 single mutants, but not the double mutants, have increased active zone density (Brp+/HRP+axonal length). Brp: Kruskal-Wallis p = 0.0012, and **p<0.01, ***p<0.001 Dunn’s post-hoc. Kek-6 mutants have reduced Synapsin, Mann-Whitney U test ***p<0.001. For statistical details, see S1 Table. N = 30–113 hemisegments. Mutant genotypes throughout figures: Control: yw/+; Mutants: kek-6–/–: kek634/Df(3R)6361; DNT2–/–: DNT237/Df(3L)6092; kek-6–/–DNT2–/–: kek634Df(3L)6092/ Df(3R)6361 DNT237.

