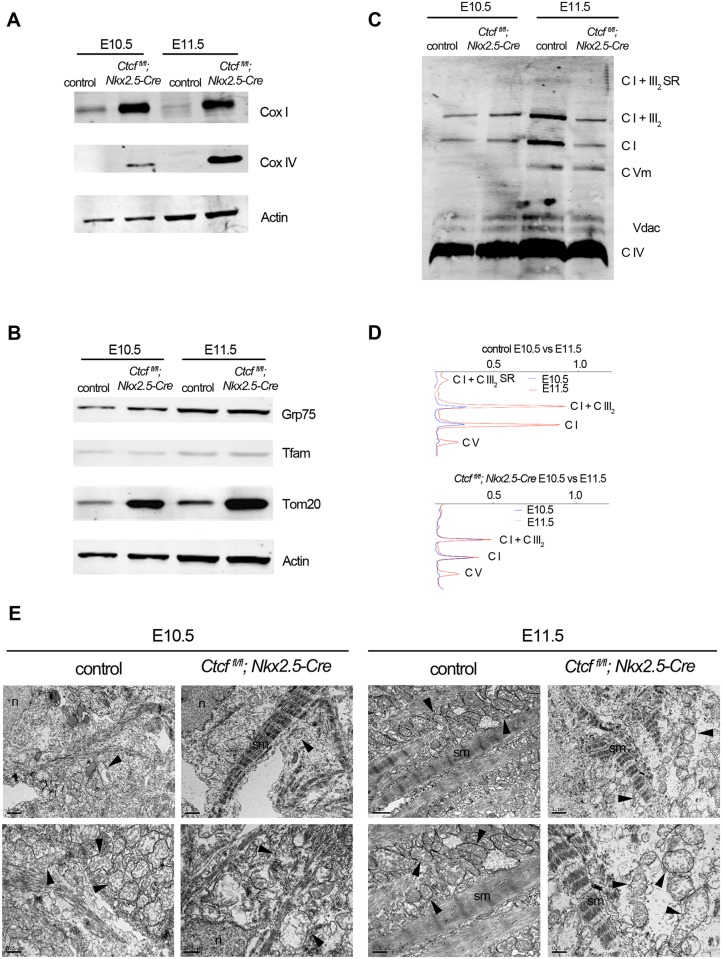
Fig 3. Defective mitochondrial biogenesis upon CTCF loss.
Western blot of Cox I, Cox IV (A), Grp75, Tfam and Tom20 (B) of control and mutant (Ctcffl/fl;Nkx2-5-Cre) hearts at E10.5 and E11.5. (C) Blue native gel of control and mutant hearts at E10.5 and E11.5 showing abundance and distribution of mitochondrial respiratory complexes (CI, CIV, CVm) and supercomplexes (CI+CIII). (D) Densitometry of blue native gel quantifying changes between E10.5 and E11.5 in complexes and supercomplexes, in control and mutant hearts. (E) Transmission Electron Microscopy at E10.5 and E11.5 in control and mutant cardiomyocytes. n, nucleus; sm, sarcomere. Arrowheads point to mitochondria. Scale bar, 1 μm top row, 0.5 μm bottom row.

