
Figure 2.
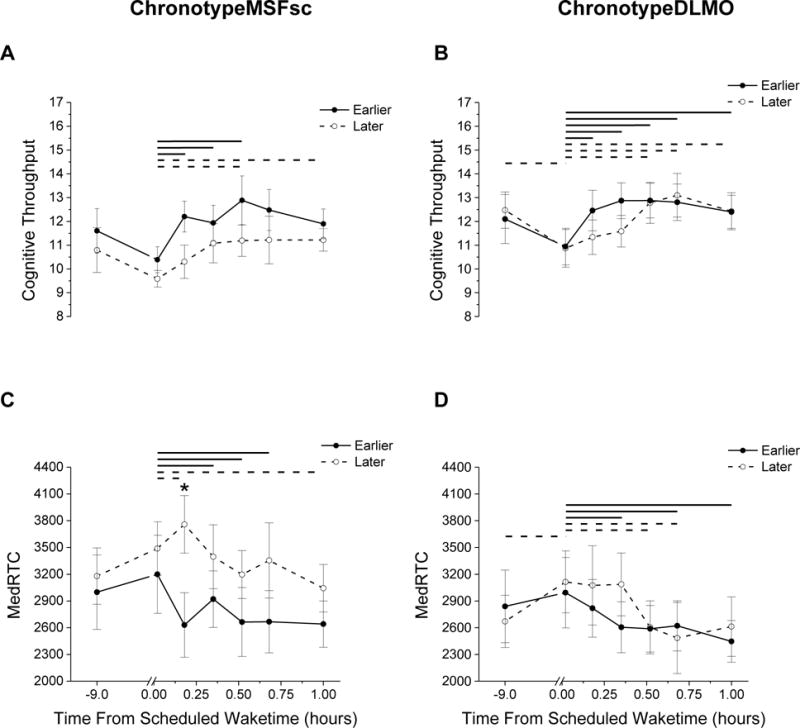
Visual search performance for the ChronotypeMSFsc group (A and C) and ChronotypeDLMO group (B and D). A and B cognitive throughput; C and D median reaction time (MedRTC). Stars above symbols represent significant (p<0.05) differences between earlier and later chronotypes. Solid and dashed lines represent significant differences (p<0.05) for time points at the ends of each line within chronotype group.