
Figure 3. Modification of relationships between pericardial fat and left ventricular geometry and function by sex, race and diabetes.
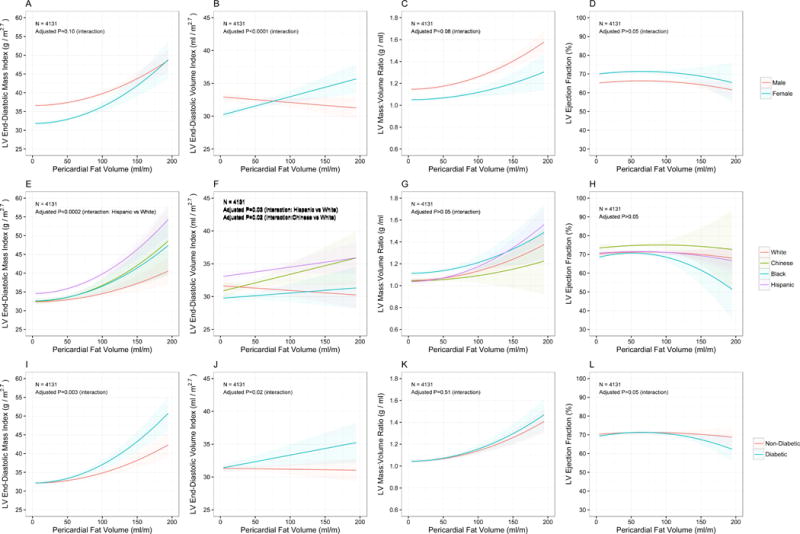
Plots in top row (A-D) evaluate effect modification by sex (male=red, female=cyan) while the middle row (E-H) evaluate effect modification by race (white=red, Chinese=green, black=blue, Hispanic=purple) and the lower row (I-L) evaluate effect modification by diabetes (non-diabetic=red, diabetic=cyan).