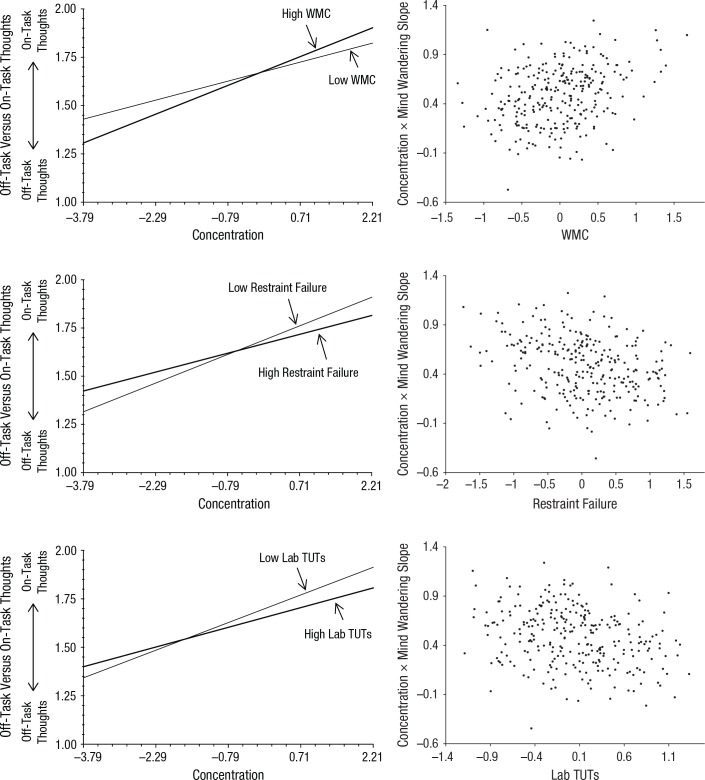
Fig. 1.
The relation between daily-life mind wandering and self-reported concentration among subjects with higher versus lower working memory capacity (WMC; top row), attention-restraint failure rates (middle row), and laboratory rates of task-unrelated thoughts (TUTs; bottom row). In the left column, the graphed lines depict the means of the within-person slopes for subjects in the top and bottom quartiles of these three executive-control abilities, and the values on the x-axis represent the group-centered ratings for daily-life concentration; the mind-wandering dependent variable was scored as either 1 (for off-task thoughts) or 2 (for on-task thoughts). In the graphs in the right column, each dot represents the results for an individual subject; values on the x-axis represent grand-mean-centered scores for WMC, rate of attention restraint failure, and laboratory TUT rate, and values on the y-axis represent the slope of the effect of concentration rating on the probability of on-task thought (vs. mind wandering) in daily life (steeper positive slopes indicate stronger positive associations between momentary concentration and on-task thinking).

