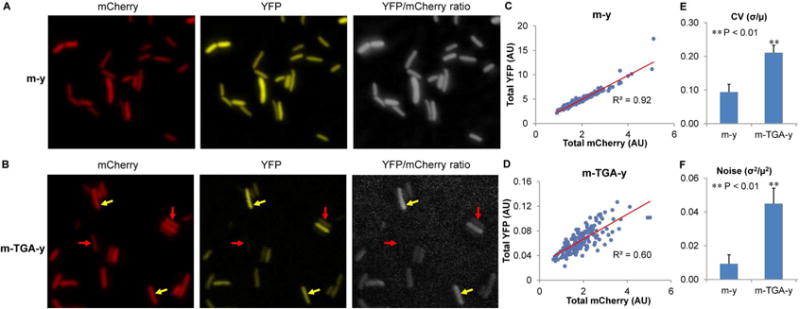
Figure 2. UGA Readthrough Is Heterogeneous among Single Cells.

(A, B) YFP and mCherry fluorescence in MG1655 cells carrying either the m-y or m-TGA-y reporter. Cells were grown in LB for 24 h. The YFP/mCherry ratio is the relative YFP signal normalized by the mCherry signal. Cells with high and low UGA readthrough are indicated by yellow and red arrows, respectively. (C, D) In the scatter plots, each dot represents a single cell. The fluorescence is background-subtracted and arbitrary units are shown. (E, F) Heterogeneity of UGA readthrough among single cells is indicated by CV and noise of the YFP/mCherry ratio. μ, the mean of the YFP/mCherry ratio; σ, standard deviation. Data are represented as mean ± standard deviation. AU, arbitrary units.
