
Figure 2. Identification of checkpoint blockade responsive B16BL6 tumor infiltrating T cellpopulations.
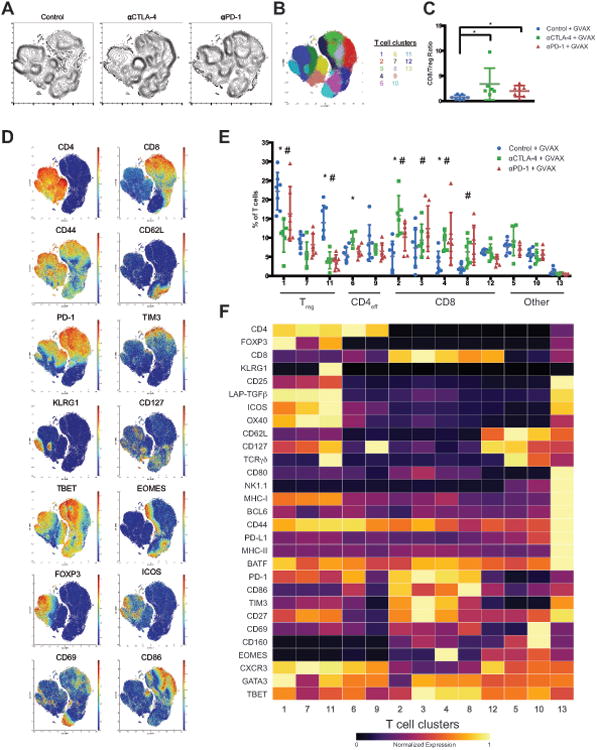
(A) Density t-SNE plots of an equal number of CD3ε+ B16BL6 tumor infiltrating T cells from eachtreatment group.
(B) t-SNE plot of infiltrating T cells overlaid with color-coded clusters.
(C) Plot of CD8/Treg ratios displayed on a per mouse basis with mean ± SD (*, P<0.05, unpaired T-test).
(D) t-SNE plot of tumor infiltrating T cells overlaid with the expression of selected markers.
(E) Frequency of T cell clusters displayed on a per mouse basis with mean ± SD (*, control v.s. anti- CTLA-4; #, control v.s. anti-PD-1; p<0.05, Dunnett's multiple comparison).
(F) Heat map displaying normalized marker expression of each T cell cluster.
Representative data from three independent experiments is shown.
See also Figure S2.