
Figure 3. B16BL6 and MC38 tumor infiltrating T cell populations are quantitatively similar.
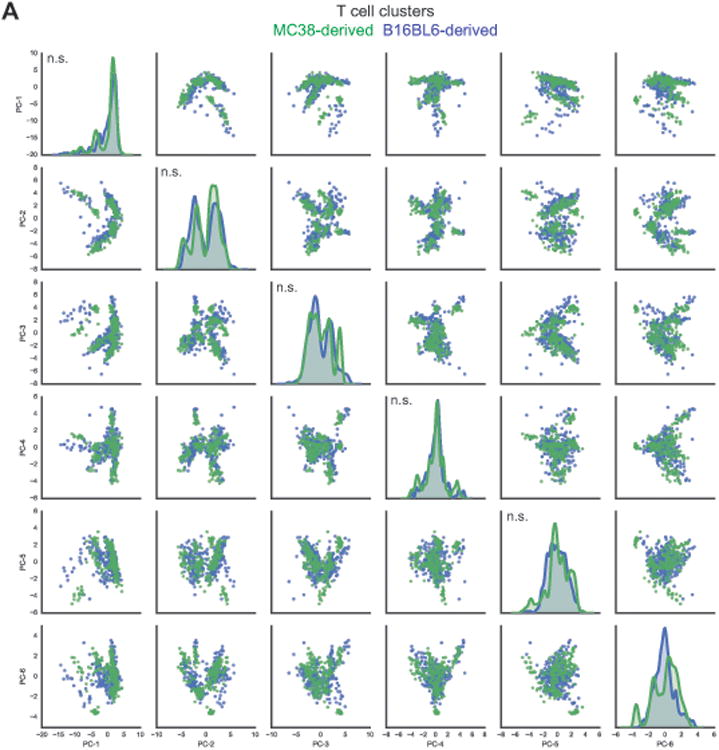
(A) PCA was applied to T cell clusters identified on a per mouse basis from MC38 and B16BL6 mass cytometry datasets. Projections of MC38 and B16BL6 infiltrating T cell clusters on to the first 6 principal components (PC), which together account for 78% of the phenotypic variance, are displayed in a pair wise fashion (MC38, green; B16BL6, blue). Univariate distributions of T cell clusters along each of the first 6 principal components are displayed along the diagonal. The Kolmogorov-Smirnov test was applied to test whether distributions of MC38 and B16BL6 derived T cell clusters along each PC are different (n.s., not significant).
See also Table S1.