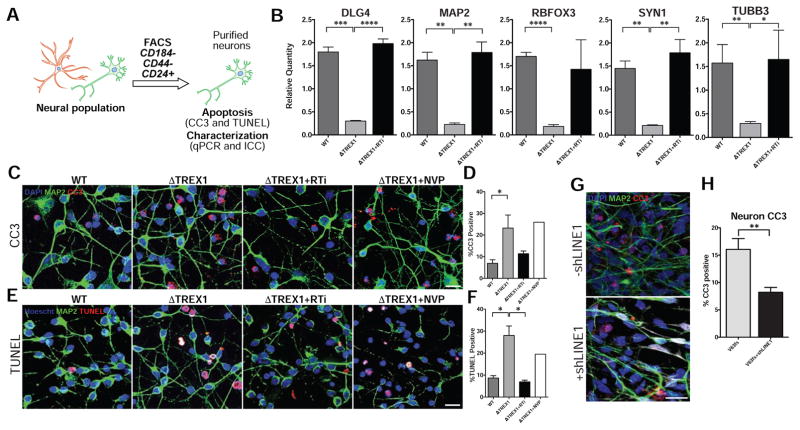
Figure 3. TREX1 deficiency promotes neurotoxicity (see also Figure S5).
A, Schematic protocol of neuronal purification by FACS. B, Expression of neuronal markers determined by qPCR. The presented values are the means ± SD (n = 3 cell lines). Expression was normalized to zero, and B2M and HPRT1 were used as dual internal references. C–F, Representative images of CC3 and TUNEL staining, along with the corresponding graphs. CC3 and TUNEL images of purified neurons were acquired, and the percentages of apoptotic cells were calculated, averaged, and graphed according to genotype (n = 3 cell lines). Each mutant line was chronically treated with RTi (3TC and d4T), and then subjected to imaging, and the results were graphed (n = 3 cell lines). The V63fs line was chronically treated with NVP, and then subjected to imaging, and the results were graphed. White arrowheads point out CC3 or TUNEL-positive cells. Scale bar, 20μm. The presented values are the means ± SD. G, Representative images of CC3 immunofluorescence in 2 week-old TREX1-deficient neurons with or without shLINE1 transduction. Scale bar, 20μm. H, Quantification of percentages of CC3-positive TREX1-deficient neurons with or without shLINE1. The presented values are the means ± SEM. Student’s t-tests were performed to compare genotypes. *P<0.05; **P<0.01.

