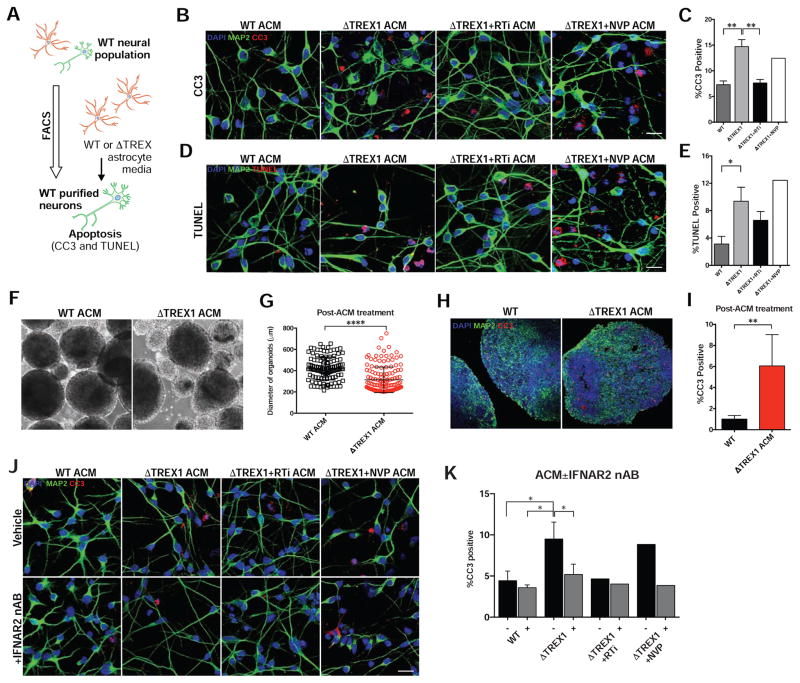
Figure 6. TREX1 deficiency in astrocytes exacerbates neurotoxicity through type-I interferons (see also Figure S6).
A, Schematic protocol of astrocyte-conditioned media experiments (ACM) on H9 purified neurons. B–E, Representative images of CC3 and TUNEL images of H9 purified neurons overlaid with ACM of different genotypes, along with corresponding graphs (n = 3 cell lines). Each mutant line was chronically treated with RTi (3TC and d4T), and RTi was removed during media conditioning (n = 3 cell lines). The V63fs line was chronically treated with NVP, and NVP was removed during media conditioning (n = 1 cell lines). Scale bar, 20μm. The presented values are the means ± standard deviation. F, Representative images of control organoids treated with conditioned media from control or V63fs mutant astrocytes. G, Scatter plot showing quantification of organoid diameter after 14 days of treatment with ACM. Each point represents one organoid (WT, n = 121 organoids, ΔTREX1, n = 145 organoids). The error bars shown represent SEM. Scale bar, 200μm. H–I, Representative images of CC3 staining of organoid after treatment with V63fs mutant ACM for 14 days, along with the corresponding graph. CC3 images of organoids were acquired, and the percentages of apoptotic cells were calculated, averaged, and graphed (WT, n = 5 organoids, ΔTREX1, n = 6 organoids). Total of 35 days of organoid differentiation. The presented values are the means ± SD. Student’s t-tests were performed to compare treatments. Scale bar, 200μm. J–K, Representative images of CC3 and images of H9 purified neurons overlaid with ACM of different genotypes with or without the addition of IFNAR2 neutralizing antibody, along with corresponding graphs (n = 3 cell lines, RTi, n = 1 cell line, NVP, n = 1 cell line). The V63fs mutant line was chronically treated with RTi (3TC and d4T), and RTi was removed during media conditioning (n = 1 cell line). The V63fs line was chronically treated with NVP, and NVP was removed during media conditioning (n = 1 cell line). Scale bar, 20μm. The presented values are the means ± SD. Student’s t-tests with Welch’s correction were performed to compare genotypes. *P<0.05; **P<0.01; ***P<0.001; ****P<0.0001.

