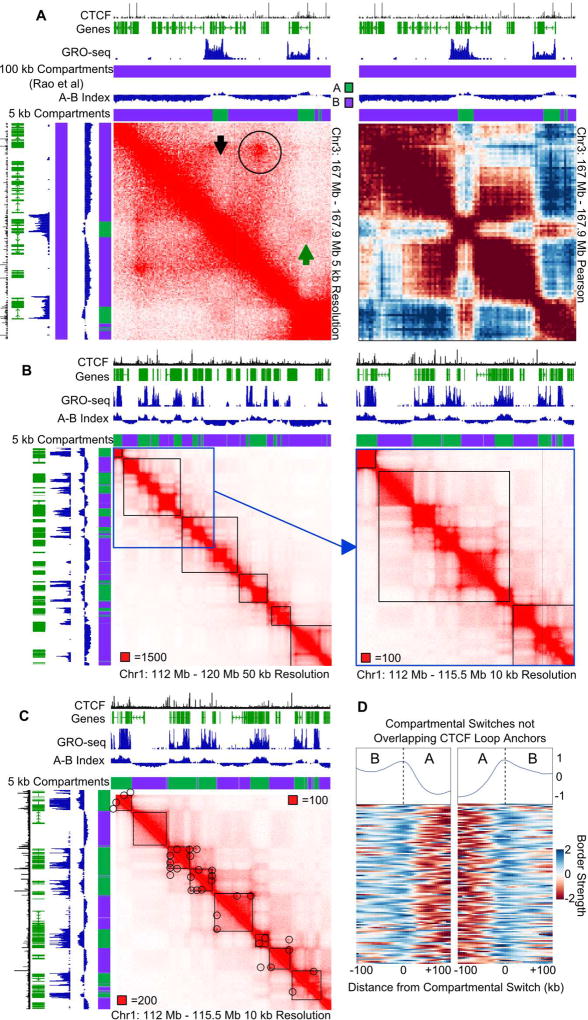
Figure 6. Compartments are Fine-scale Structures in Human Cells.
A. Compartment identification using an A-B index obtained at 5 kb and previously reported compartments at 100 kb, showing identification of smaller A (green) and B (purple) compartments. Gene annotations are shown above and to the left. Left: Hi-C map at 5 kb resolution. Circle indicates a CTCF loop, black arrow indicates a distinct compartment switch within a CTCF loop, green arrow indicates inter-A compartment interactions. Right: Pearson correlation map showing A and B associations.
B. Compartmentalization subdivides low-resolution TADs. Black squares denote TAD calls at 40 kb(Moore et al., 2015). Blue square denotes area depicted to the right at higher resolution.
C. High resolution TAD calls identify small domains. Black squares denote high resolution TAD calls. Circles denote CTCF loops.
D. Compartments create domains in humans. Boundary score at compartmental switches more than 50 kb from a CTCF loop anchor. The median profile is shown above.
See also Figure S6.

