Figure 2.

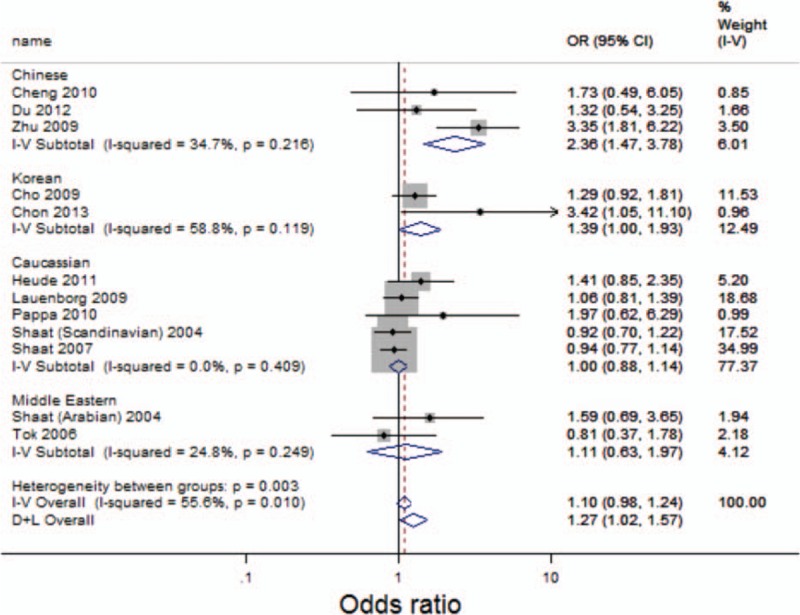
Forest plot of GDM risk associated with the Pro allele at amino acid position 12. CI = confidence interval, D + L = DerSimonian and Laird method, I-V = inverse variance, OR = odds ratio.

Forest plot of GDM risk associated with the Pro allele at amino acid position 12. CI = confidence interval, D + L = DerSimonian and Laird method, I-V = inverse variance, OR = odds ratio.