
Figure 6.
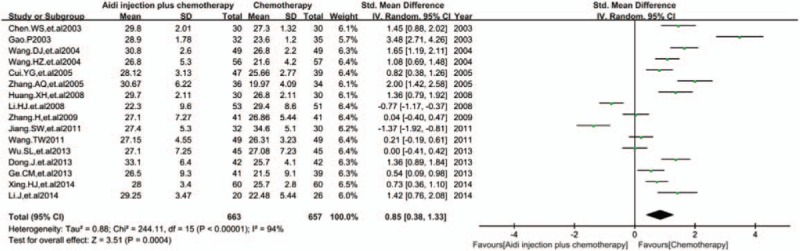
Meta-analysis of CD8+T cells. Meta-analysis showed that the percentage of CD8+T cells was statistically different between the 2 groups [SMD = 0.85, 95% CI (0.38, 1.33), P = 0.0004] by random effect model. SMD = standardized mean difference.