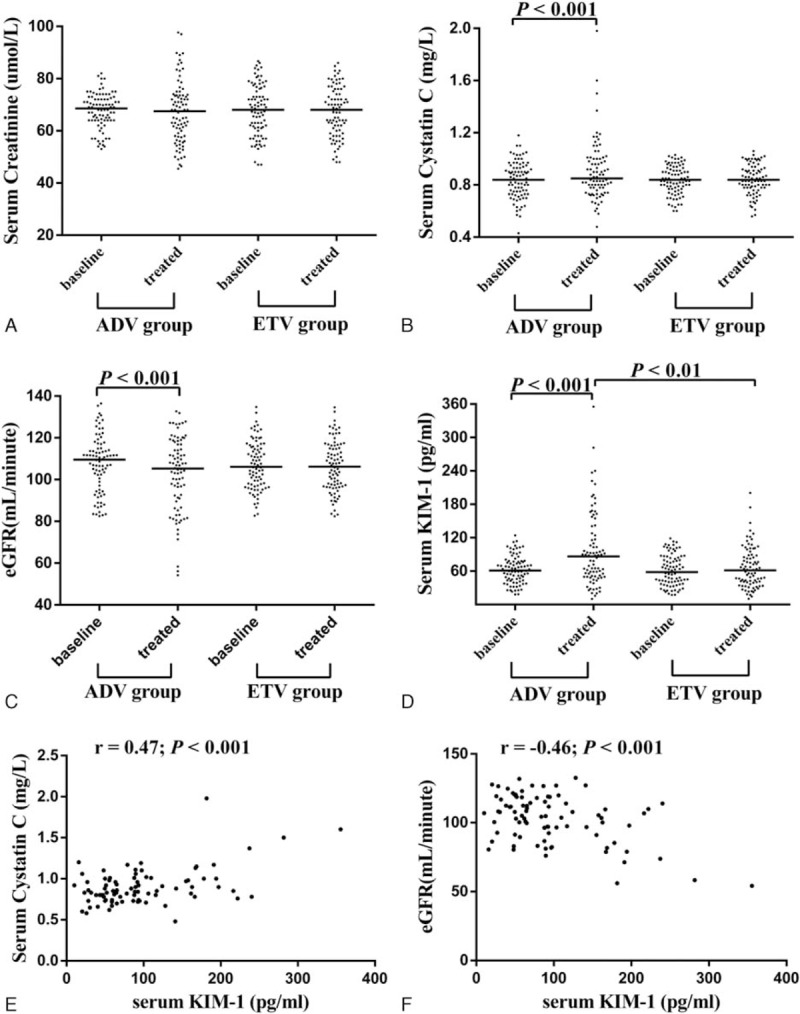
Figure 2.

Evolution of various renal dysfunction indicators from baseline. Dot plots indicate serum creatinine (A), serum cystatin C (B), estimated glomerular filtration rate (eGFR) (C), and serum kidney injury molecule-1 (KIM-1) (D) for each patient. Scatterplot demonstrating a correlation between serum KIM-1 levels and serum cystatin C levels (r = 0.47; P < 0.001) (E), scatterplot demonstrating a correlation between serum KIM-1 levels and eGFR levels (r = -0.46; P < 0.001) (F).
