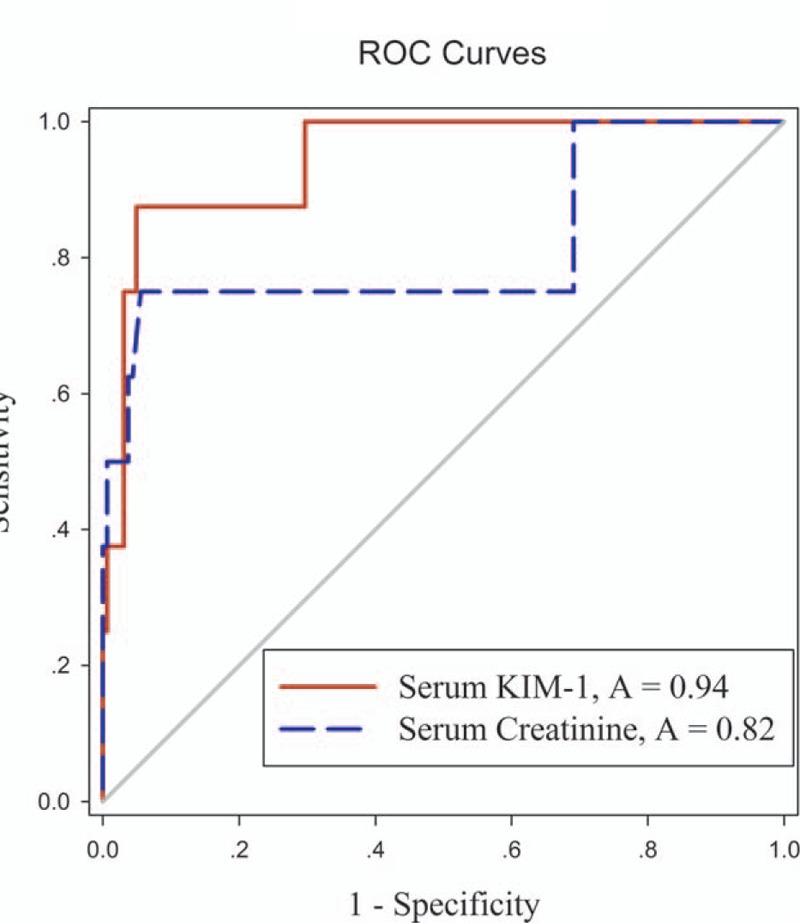
Figure 3.

ROC curve analysis comparing performance of serum KIM-1 (solid red line, AUC 0.94) and serum creatinine (dashed blue line, AUC 0.82) levels. AUC = area under the ROC curve, KIM-1 = kidney injury molecule-1, ROC = receiver operating characteristic curve.
