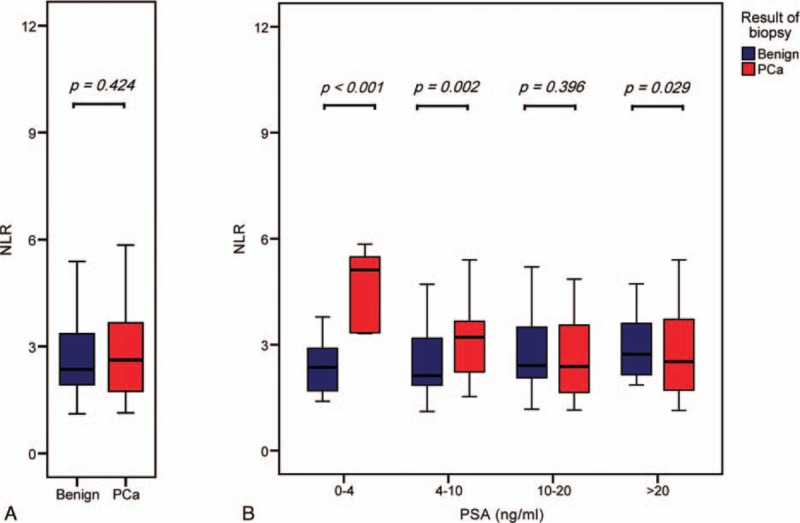
Figure 1.

Box plot of NLR value grouped by pathologic results in prostate biopsy. (A) In the entire cohort. (B) In the 4 groups with different PSA range: 0 to 4, 4 to 10, 10 to 20, more than 20 ng.ml−1. There was no statistically significant difference between these 2 groups in the entire cohort (median 2.62, IQR 1.74–3.66; median 2.36, IQR 1.93–3.36, respectively, P = 0.424), but significant differences in the 3 subgroups except a subgroup with PSA ranged from 10 to 20 ng.ml−1. NLR = neutrophil-to-lymphocyte ratio, IQR = interquartile range, PCa = prostate cancer, PSA = prostate specific antigen.
