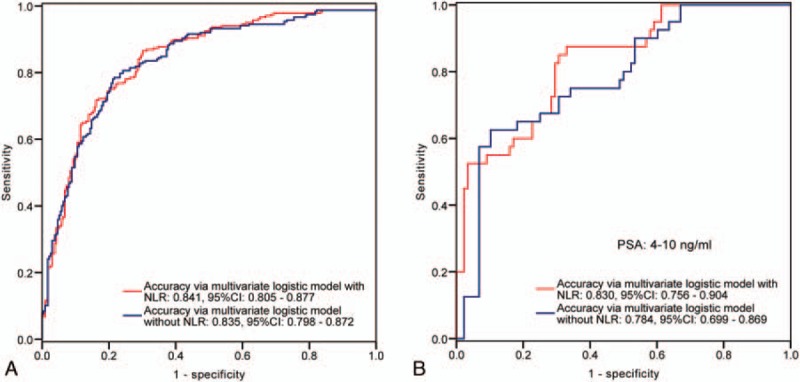
Figure 2.

ROC curves of the multivariate logistic regression model with or without NLR value in prediction of PCa in the entire cohort (A) and in the subgroup with PSA ranged from 4 to 10 ng.ml−1 (B). As can be observed, in the entire cohort, the accuracy of the multivariate logistic model with NLR is close to the model without NLR. Nevertheless, in the subgroup with PSA ranged from 4 to 10 ng.ml−1, the adding of NLR value leads 4.6% up of the accuracy. AUC = area under the curve, NLR = neutrophil-to-lymphocyte ratio, PCa = prostate cancer, PSA = prostate specific antigen, ROC = receiver operating characteristic.
