Supplemental Digital Content is available in the text
Keywords: endoluminal ultrasound, magnetic resonance imaging, rectal neoplasm, tomography, tumor staging, x-ray computed
Abstract
Background:
Magnetic resonance imaging (MRI), endoluminal ultrasound (EUS), and computed tomography (CT) are commonly used imaging tools to evaluate rectal tumor staging, but there was no recent meta-analysis to define the present role of the 3 tools. Here, we proposed to systematically compare the accuracy of the 3 imaging tools for rectal tumor staging.
Methods:
We systematically searched diagnostic accuracy studies of MRI, CT, or EUS on rectal cancer staging, written in English or Chinese, published between January 1, 2003 and Dec 31, 2015 from database of PubMed, EMBASE, and Cochrane Library. The reference standards should be pathological findings. Hierarchical regression model was used for producing summary receiver operating characteristic (SROC) curves and calculating diagnostic accuracy data including sensitivity, specificity, and diagnostic odds ratio for the 3 imaging tools. Investigation of sample size, quality items and resolution, and magnetic field strength on heterogeneity was detected by using subgroup analysis and SROC regression.
Results:
This analysis included 89 studies. MRI, CT, and EUS yielded similar diagnostic accuracy. Better performance was observed with high-resolution MRI and 3.0-T MRI (P = 0.01 and 0.04, respectively). EUS showed lower diagnostic accuracy after preoperative therapies (P = 0.03).
Conclusion:
MRI, CT, and EUS have comparable accuracy for rectal tumor staging. High-resolution MRI and 3.0-T MRI can produce better staging results and were recommended. EUS is not suitable for rectal tumor staging for its significantly decreased accuracy.
1. Introduction
Rectal cancer is one of the leading causes of cancer-related deaths.[1] Accurate definition of tumor stages of rectal cancer is important for assigning patients to the appropriate therapies[2] and predicting the prognosis as T3/T4 tumors often showed poor survival outcomes.[3]
Currently, the magnetic resonance imaging (MRI), computed tomography (CT), and endoluminal ultrasound (EUS) are the most commonly used noninvasive imaging tools for evaluating tumor stages before neoadjuvant therapies and/or surgery. The imaging results enable clinical practitioners to determine if a patient needs neoadjuvant therapy and how he/she responds to the treatment.[2,4]
A meta-analysis published in 2004 by Bipat et al[5] concluded that EUS had better accuracy in defining tumor stages than MRI and CT in rectal cancer patients. However, this study included papers published before 2002 when clinical practitioners started to apply MRI in tumor staging of rectal cancer for a short period. The low-resolution scanner which applied insufficient image matrix size and insufficient diagnostic experience of radiologists might both contribute to the poor performance of MRI.
Recently, the development of high-spatial-resolution MRI has improved its diagnostic accuracy for tumor staging because it provides precise clarification between tumor tissue and the mesorectal fascia.[6] Meanwhile, adding multiplanar reconstructions of multidetector CT definitely improves the staging accuracy for rectal cancer with comparison of standard axial reconstructions alone.[7] However, there remains a lack of information concerning the diagnostic accuracy of novel ultrasound techniques, and the application of EUS was limited by its inability for stenotic tumors.[8]
There has been some meta-analysis including recent literature to assess the performance of MRI for rectal tumor staging, but there is no recent meta-analysis focusing on the comparative accuracy of MRI, CT, and EUS.[9,10] Thus, we proposed this meta-analysis to obtain the comparative accuracy of MRI, CT, and EUS in rectal cancer staging in an attempt to define their present roles in clinical practice.
2. Methods
This is a meta-analysis and included previously published studies; thus, no ethical approval and patient consent are required.
2.1. Systematic literature search
Diagnostic accuracy studies for rectal cancer staging published between January 1, 2003 and December 31, 2015 were comprehensively searched from PubMed, EMBASE database, and Cochrane Library. We used following text words “Rectal Neoplasms” and “Neoplasm Staging” OR “Muscularis Propria” and “Diagnostic Imaging” OR “Magnetic Resonance Imaging” OR “Ultrasonography” (MeSH) OR “Tomography, X-Ray Computed”. To identify relevant studies, reference lists of full-text papers were retrieved and searched manually.
2.2. Study inclusion
Studies recruited in this analysis should meet all inclusion criteria: written in English or Chinese language; no less than 20 histologically proven primary rectal cancer patients; evaluation of rectal cancer staging using MRI, EUS, or CT; histopathology used as the reference standard; sufficient diagnostic accuracy data for T-staging; patients enrolled in a single group with tumor stages unknown at enrollment. If there were duplicate data reported, the study which reported the most detailed data or had the largest sample size was chosen.
All identified studies (titles and abstracts) were reviewed to judge whether they meet the inclusion criteria or not. Two raters assessed all searched studies independently. If disagreements appeared on study inclusion, they discussed first and a third reviewer was provided for arbitration who at last made the consensus.
2.3. Data extraction
Two raters extracted study information into the data extraction form (Supplementary table 1) independently. The QUADAS-2 scale[11] was used to extract quality-related information (Supplementary table 2). Then 2 raters evaluated the quality of all included studies independently. Studies were considered as at “low risk of bias” or “low concern regarding applicability” if all domains of bias or applicability were assessed as “low”. Studies were regarded as being “at risk of bias” or as having “concerns regarding applicability” if there was “high” or “unclear” judgment in 1 or more domain.
We extracted patient-level diagnostic accuracy data on rectal cancer staging from each study and reconstructed them into 2 × 2 tables by defining T3 and T4 as “tumors invading through the muscularis propria” and T2 and lower stages as “tumors confined to the muscularis propria”. All tabulated results were extracted. When there were diagnostic accuracy results of more than 1 rater, we selected the one with the highest sensitivity for analysis.
2.4. Statistical method
Diagnostic accuracy data including sensitivity, specificity, and diagnostic odds ratio (DOR) was calculated for the 3 index methods using hierarchical summary receiver operating characteristic (SROC) model,[12] which provides more between- and within-study variability, allowing of test stringency and accuracy to vary across studies. SROC curves were established to summarize true- and false-positive rates.
The heterogeneity was determined by subgroup analysis and SROC regression. The methodological quality rating items and sample size were included in the heterogeneity analysis. Then, subgroup analyses compared outcomes in the patients with and without preoperative therapy; the accuracy with high-resolution MRI (defined as slice thickness ≤4 mm and matrix ≤0.625) and without this technique; with high field strength MRI and without high field strength MRI. A second analysis was performed on studies which evaluated index tests directly. Publication bias was evaluated by using effective sample size funnel plots.[13]
Statistical analyses was undertaken with STATA statistical package (version 10.0, STATA, College Station, TX, USA). P value less than 0.05 indicated statistical significance.
3. Results
3.1. Literature search and study selection
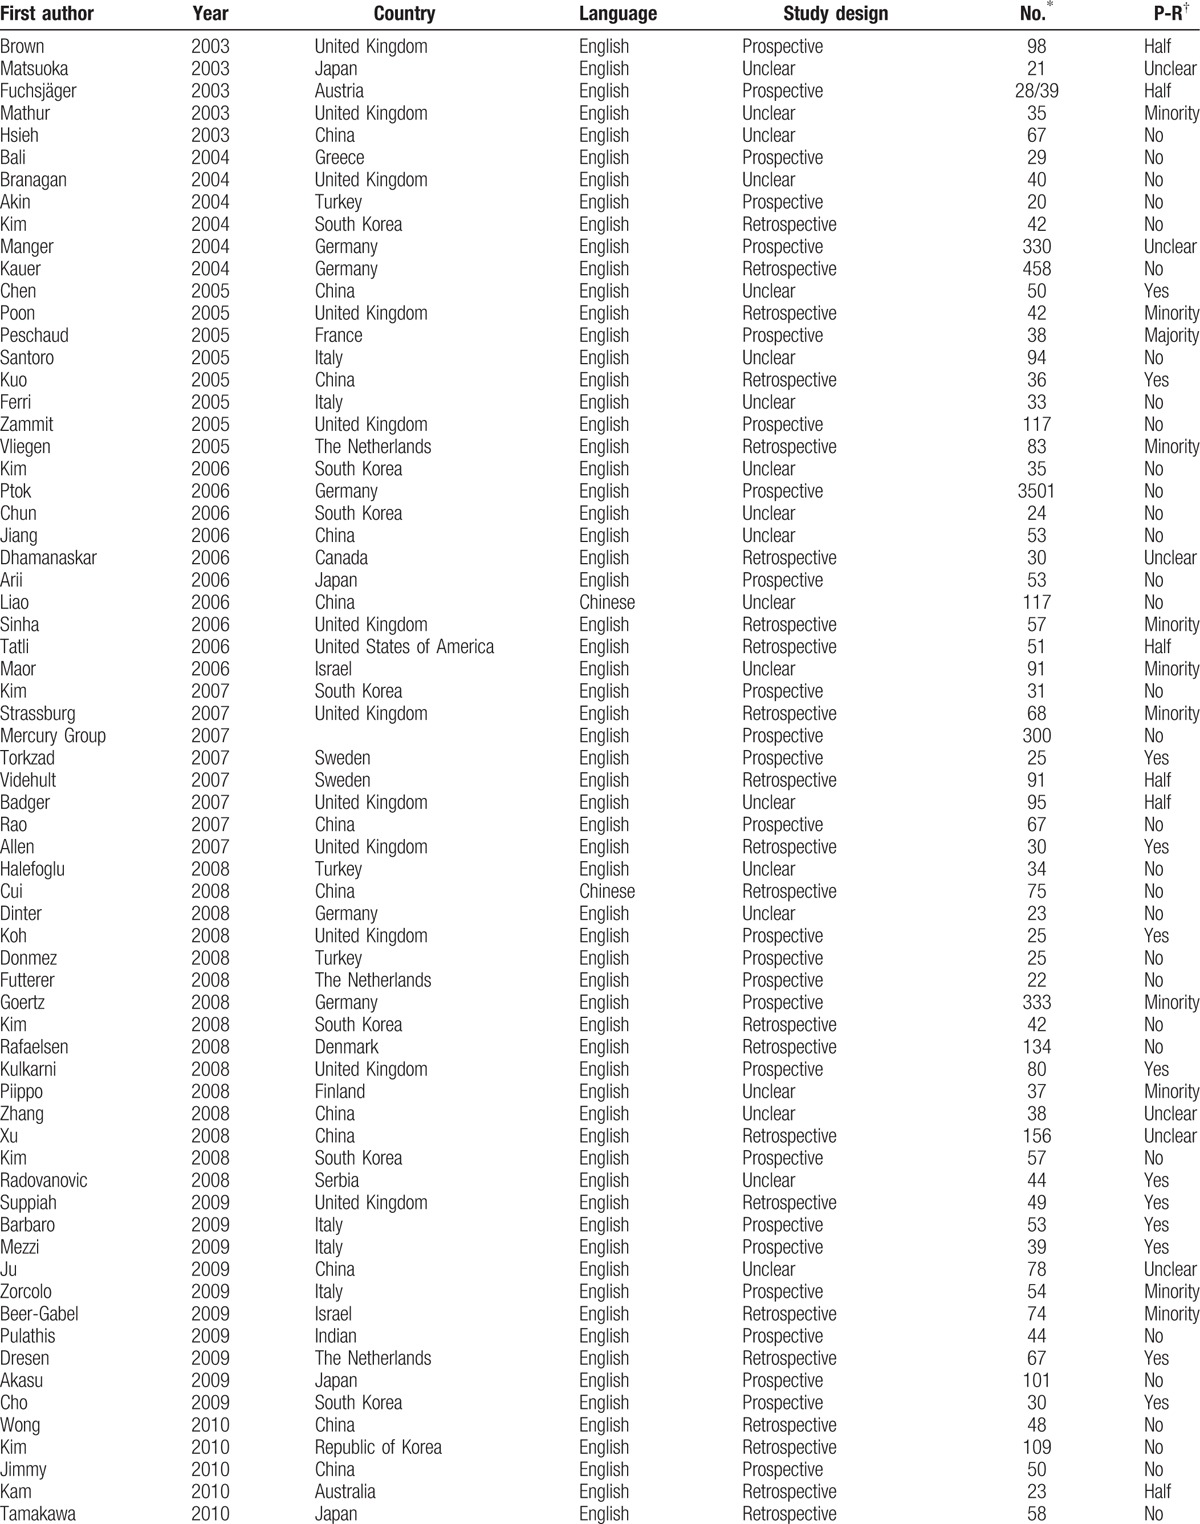
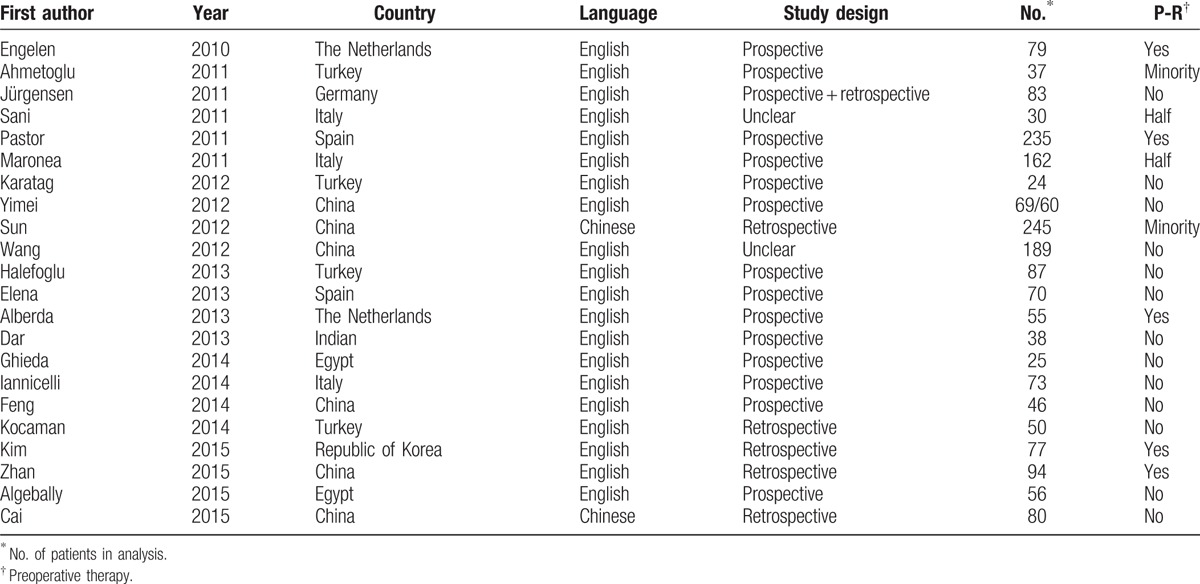
The initial search identified 1042 abstracts, 801 articles were excluded because of diagnostic information missing. A total of 241 articles were considered relevant and acquired for full-text reading. Finally, 89 articles were included for meta-analysis (Fig. 1, Table 1 , Supplementary article list).
Figure 1.
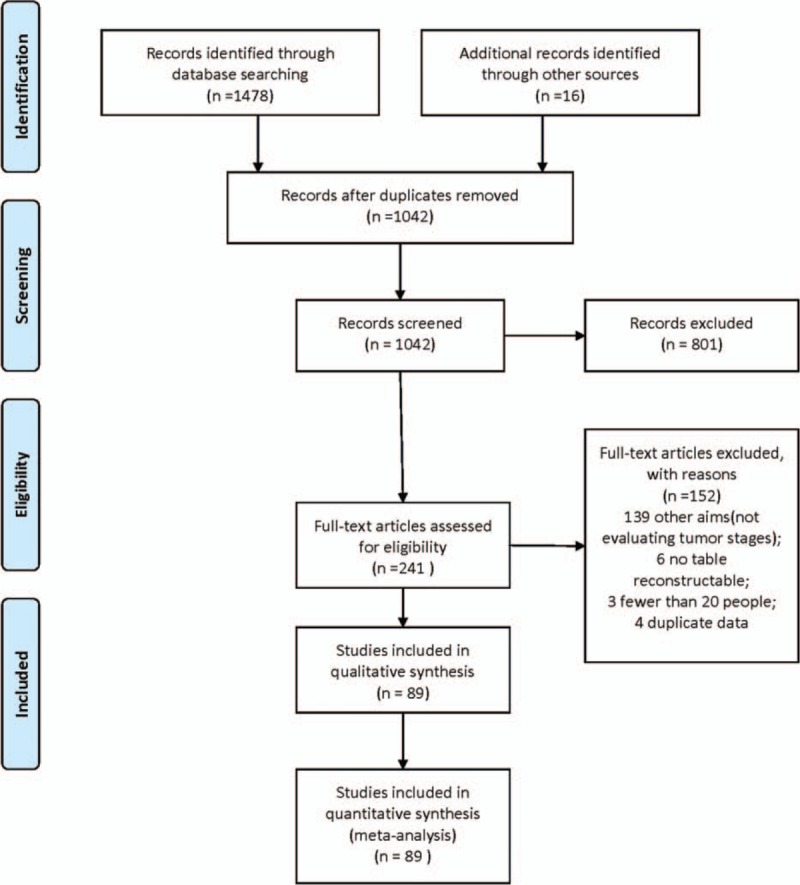
Flow diagram of the literature search.
Table 1.
Population and study characteristics of 89 studies included in the meta-analysis.
3.2. Summary of quality assessment
The studies included in this meta-analysis had an overall of 9141 patients (range: 20–3501 patients per study). Sixty-two studies (3887 patients) provided diagnostic accuracy data for MRI, 32 studies (6659 patients) used EUS, and 9 studies (407 patients) used CT. Nine studies (439 patients) provided diagnostic accuracy data of 2 imaging tools (5 studies for MRI and EUS; 1 study for CT and EUS; and 3 studies for CT and MRI), and 2 studies provided data of MRI, CT, and EUS.
The quality assessment results are presented in Fig. 2. Six studies (6.7%) were judged at “low risk of bias”, the other 83 studies (93.3%) were judged to be “at risk of bias”. Forty studies (44.9%) were judged at “low concern regarding applicability”, the other 49 studies (55.1%) were judged to have “concerns regarding applicability”.
Figure 2.
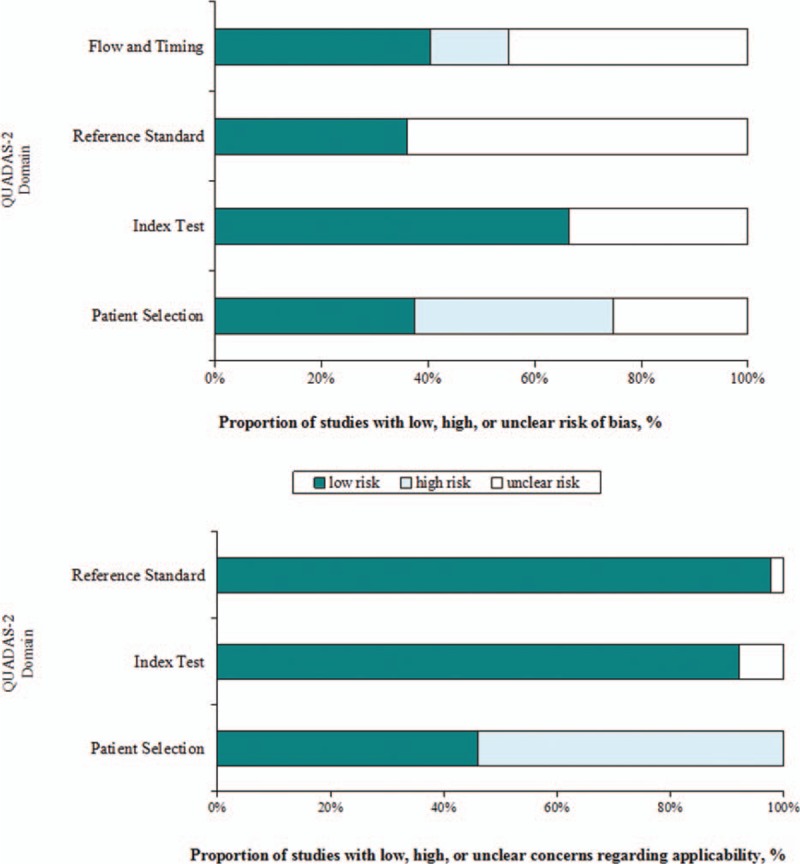
Summary quality assessment of studies using QUADAS-2 criteria.
3.3. Diagnostic performance of MRI, CT, and EUS for T-staging
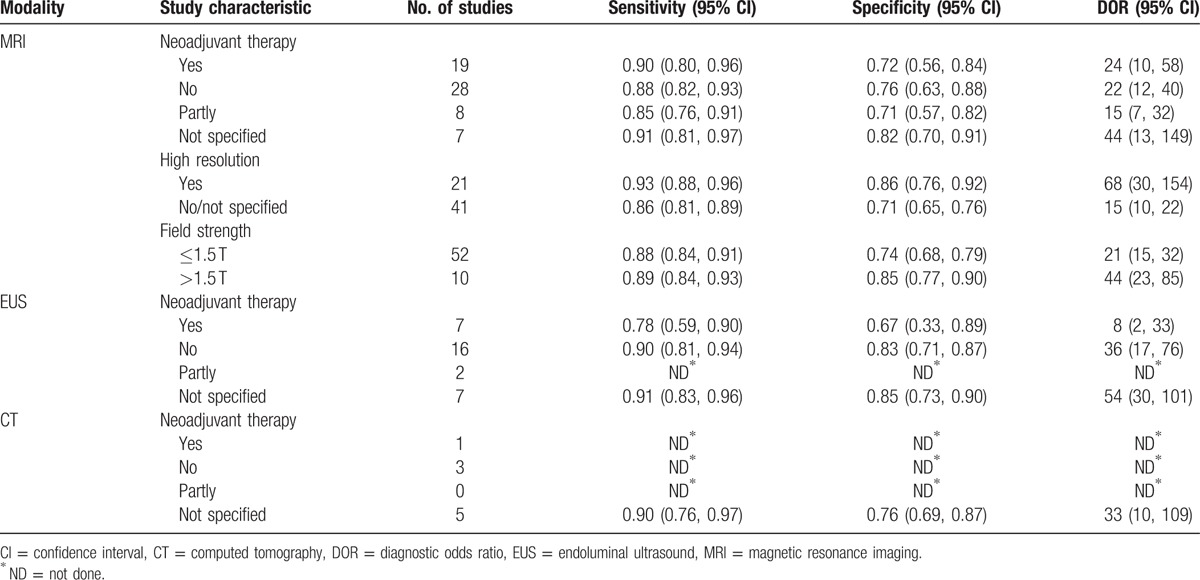
Table 2 summarized the sensitivity, specificity, and DOR estimates of MRI, EUS, and CT.
Table 1 (Continued).
Population and study characteristics of 89 studies included in the meta-analysis.
EUS studies at “low risk of patient selection bias” produced inferior accuracy (P = 0.04). MRI studies containing no less than 50 patients showed better performance than studies with small sample size (P = 0.04). Neither sample size nor quality items played a role in diagnostic accuracy for CT studies.
EUS studies showed lower diagnostic accuracy in patients undergoing preoperative therapies (P = 0.03) than in patients not receiving neoadjuvant therapy. However, MRI studies presented no statistical difference between patients with and without preoperative therapies (P = 0.23) (Table 3).
Table 2.
Summary estimates of sensitivity, specificity and DOR for MRI, EUS, and CT in the tumor staging of rectal cancer.

Diagnostic accuracy was significantly higher in 21 studies using high-resolution MRI for T-staging than in 41 studies that did not use this technique (P = 0.01; Table 2). SROC curves showing evidence of improvement in diagnostic performance using high-resolution MRI are shown in Fig. 3.
Figure 3.
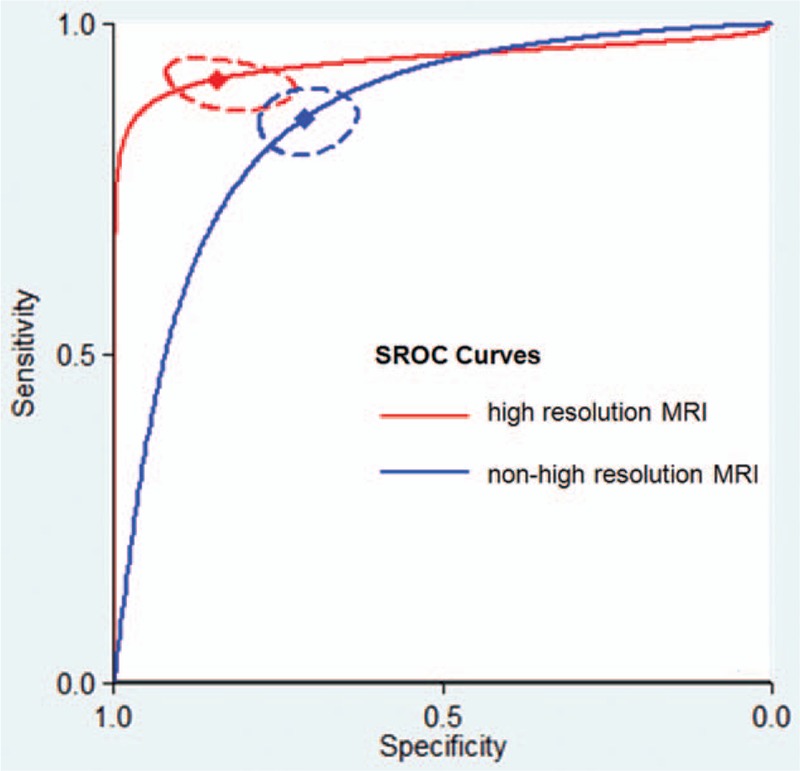
Summary receiver operating characteristic (SROC) curves comparing the diagnostic accuracy of high-resolution magnetic resonance imaging (MRI) and nonhigh-resolution MRI for T-staging in rectal cancer patients. The red diamond represents the summary operating point for high-resolution MRI. The blue diamond represents the summary operating point for nonhigh-resolution MRI. The dotted red and blue lines represent the corresponding 95% confidence intervals. Sensitivity is shown on the y-axis, and specificity on the x-axis. The solid red and blue lines represent the SROC curves.
Seven studies using MRI with a field strength >1.5 T showed higher diagnostic accuracy than MRI studies where the field strength was ≤1.5 T (P = 0.04; Table 3). SROC curves showing evidence of improvement in diagnostic performance using MRI with a field strength >1.5 T are shown in Fig. 4.
Figure 4.
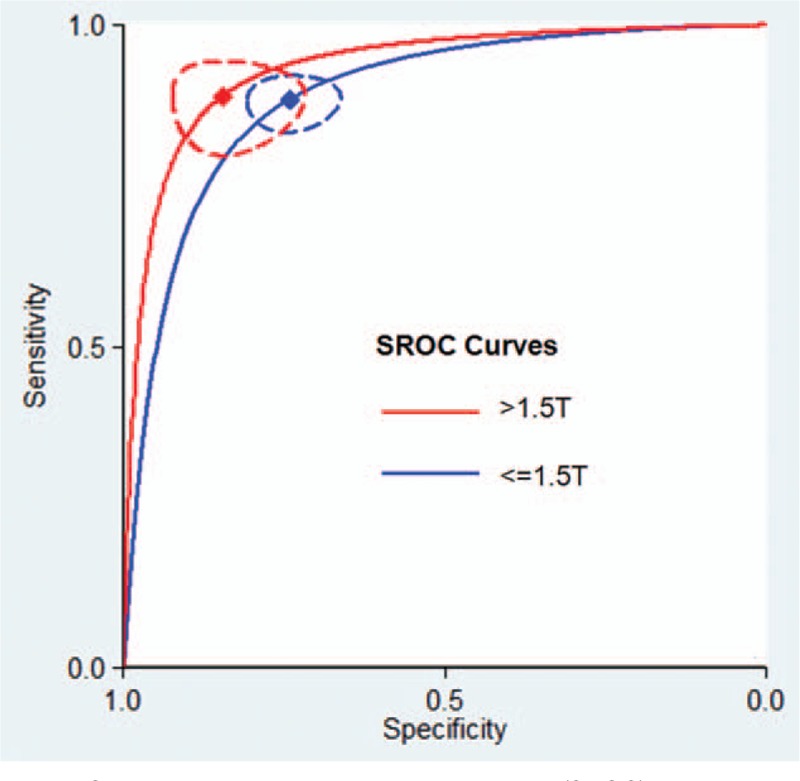
Summary receiver operating characteristic (SROC) curves comparing the diagnostic accuracy of high-field magnetic resonance imaging (MRI) (>1.5 T) and nonhigh-field MRI (≤1.5 T) for T-staging in rectal cancer patients. The red diamond represents the summary operating point for MRI with a field strength >1.5 T. The blue diamond represents the summary operating point for MRI with a field strength ≤1.5 T. The dotted red and blue lines represent the corresponding 95% confidence intervals. Sensitivity is shown on the y-axis, and specificity on the x-axis. The solid red and blue lines represent the SROC curves.
3.4. Comparative accuracy of MRI, CT, and EUS for T-staging
The diagnostic accuracy for rectal cancer staging was similar among MRI, EUS, and CT (MRI vs EUS, P = 0.58; MRI vs CT, P = 0.77; EUS vs CT, P = 0.89). Figure 5 presented the corresponding SROC curves.
Figure 5.
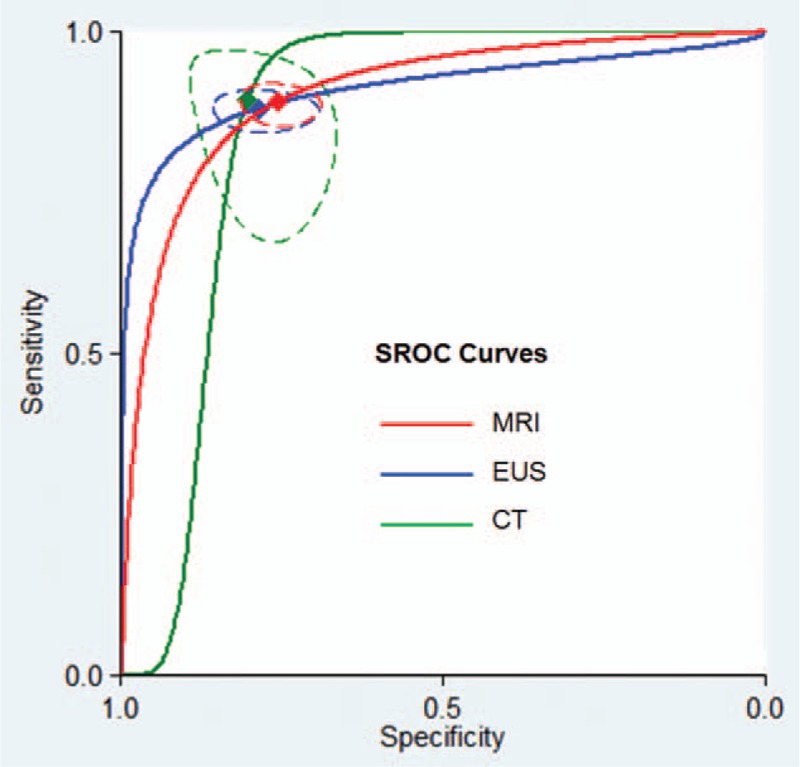
Summary receiver operating characteristic (SROC) curves comparing the diagnostic accuracy of the magnetic resonance imaging (MRI), computed tomography (CT), and endoluminal ultrasound (EUS) for T-staging in rectal cancer patients. The red diamond represents the summary operating point for MRI. The blue diamond represents the summary operating point for EUS. The green diamond represents the summary operating point for CT. The dotted lines represent the corresponding 95% confidence intervals. Sensitivity is shown on the y-axis, specificity on the x-axis. The solid lines represent the SROC curves.
High-resolution MRI showed similar accuracy for rectal cancer staging compared with CT (P = 0.24) and EUS (P = 0.06) (Table 4). High field strength MRI (>1.5 T) also yielded equivalent diagnostic performance compared with CT (P = 0.66) and EUS (P = 0.35) (Table 4).
Table 3.
Sensitivity, specificity, and DOR for T-staging in a priori defined subgroups.
There was no statistical difference between MRI and EUS for rectal cancer staging in patients with preoperative therapies (P = 0.55). MRI, CT, and EUS also showed comparable accuracy when only studies at low risk of patient selection bias were considered. Moreover, MRI, CT, and EUS studies with large sample size (≥50 subjects) also presented similar performance (Table 3).
There were no differences for tumor staging between either of the 2 modalities (Table 5).
Table 4.
Comparisons of diagnostic accuracy for T-staging between 3 imaging tools.
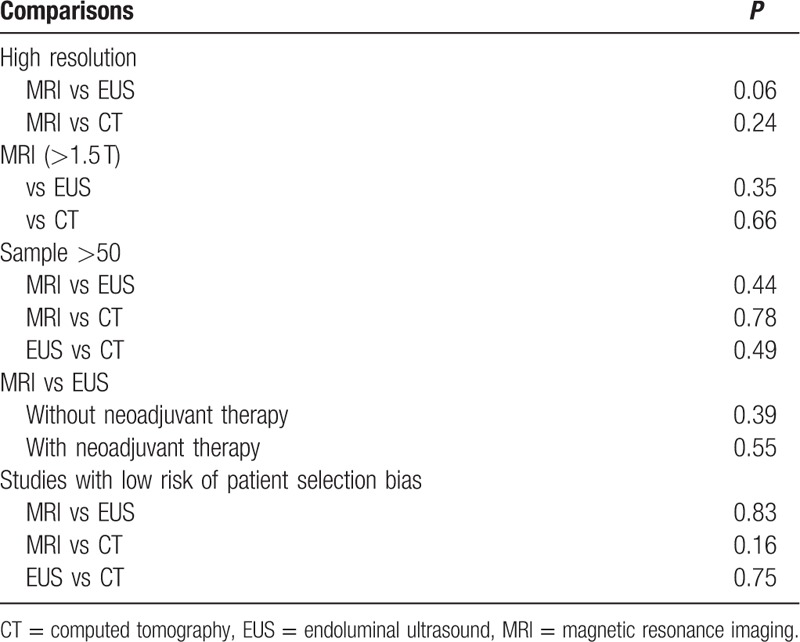
Table 5.
Direct comparison of diagnostic accuracy of MRI, EUS, and CT in T-staging.

3.5. Publication bias
The analysis showed that EUS studies yielded statistically significant publication bias (P = 0.01), and studies with smaller sample size were inclined to yield higher diagnostic accuracy. On the contrary, there was no statistically significant publication bias in MRI and CT studies. Effective sample size funnel plots are presented in Fig. 6.
Figure 6.

Funnel plot of the reciprocal of effective sample size plotted on the y-axis against the diagnostic odds ratio plotted on the x-axis. The regression line is used as a measure of asymmetry. The circles represent included studies. (A) Magnetic resonance imaging studies, (B) endoluminal ultrasound studies, and (C) computed tomography studies.
4. Discussion
In this meta-analysis, high-resolution MRI and MRI with higher field strength (>1.5 T) showed higher diagnostic accuracy for rectal cancer staging. High-resolution MRI has been increasingly used on account of its accurate spatial depiction of tumor[6] and thus can better identify T3/4 tumors from T1/2 tumors. MRI with higher field strength produces images with increased signal-to-noise ratio,[14] which also promote accurate judgment of muscularis propria invasion.
MRI has an obviously wider range of application than EUS which is only applicable to nonstenotic patients and is free of radiation compared with CT. Thus, MRI should be recommended as the first choice for patients with rectal cancer undergoing radiologic examinations. EUS provides a complementary method for patients with early-stage cancer which has been identified by MRI.
Lower diagnostic accuracy for rectal cancer staging was observed with MRI and EUS in patients who received neoadjuvant therapies than in patients undergoing surgery directly. However, only EUS studies showed a statistically significant decline in diagnostic accuracy for T-staging of rectal cancer. Thus, MRI should be recommended for restaging after neoadjuvant therapy. Furthermore, evaluation for tumor stages is important for assessing therapeutic efficacy, thus MRI is also the best choice for the first tumor staging in rectal cancer patients with neoadjuvant therapy.
Meanwhile, EUS studies with large sample size were inclined to be less accurate for rectal cancer staging according to the regression analysis and funnel plots. This finding suggests that high-quality diagnostic accuracy studies with large sample sizes are needed to validate the performance of EUS for tumor staging.
This meta-analysis has several limitations. Most studies reported inadequate information on patient selection, index test, reference standard, and flow and timing (as signaling questions listed in Supplementary table 1), thus we cannot conduct further analysis on quality-related items. In addition, publication bias might be introduced from inclusion of studies written in English or Chinese only. Although the advantage of MRI was attributed to the use of high-resolution or >1.5-T MRI, few studies provided data on these aspects to enable direct comparison of high-resolution MRI or >1.5-T MRI with EUS or CT.
Our results suggest that patients with rectal cancer should initially undergo an MRI examination for tumor staging. Those with MRI-defined T1/T2 disease may be candidates for subsequent EUS examination. We also recommend using MRI instead of EUS for patients with neoadjuvant therapy. High-resolution MRI should be used routinely together with 3-T MRI if conditions allow. These techniques provide excellent discrimination between T2 and borderline T3 cancers.
Supplementary Material
Footnotes
Abbreviations: CI = confidence interval, CT = computed tomography, DOR = diagnostic odds ratio, EUS = endoluminal ultrasound, MRI = magnetic resonance imaging, SROC = summary receiver operating characteristic.
Funding/support: This work was supported by the National Natural Science Foundation of China (grant no. 81471640).
The authors have no conflicts of interest to disclose.
Supplemental Digital Content is available for this article.
References
- 1.Siegel R, Miller KD, Jemal A. Cancer statistics, 2015. CA Cancer J Clin 2015; 65:5–29. [DOI] [PubMed] [Google Scholar]
- 2.NCCN org. NCCN Guidelines Rectal Cancer Guidelines (2015). Available at:, https://www.nccn.org/professionals/physician_gls/pdf/rectal.pdf (Accessed: 9th Oct 2015). [Google Scholar]
- 3.American Joint Committee on Cancer. AJCC Cancer Staging Handbook from the AJCC Cancer Staging Manual. 7th ed.2010; Chicago, IL:American Joint Committee on Cancer, 173–206. [Google Scholar]
- 4.Barbaro B, Fiorucci C, Tebala C, et al. Locally advanced rectal cancer: MR imaging in prediction of response after preoperative chemotherapy and radiation therapy. Radiology 2009; 250:730–739. [DOI] [PubMed] [Google Scholar]
- 5.Bipat S, Glas AS, Slors FJM, et al. Rectal cancer: local staging and assessment of lymph node involvement with endoluminal US, CT, and MR imaging-a meta-analysis. Radiology 2004; 232:773–783. [DOI] [PubMed] [Google Scholar]
- 6.Brown G, Richards CJ, Newcombe RG, et al. Rectal carcinoma: thin-section MR imaging for staging in 28 patients. Radiology 1999; 211:215–222. [DOI] [PubMed] [Google Scholar]
- 7.Kulinna C, Eibel R, Matzek W, et al. Staging of rectal cancer: diagnostic potential of multiplanar reconstructions with MDCT. AJR Am J Roentgenol 2004; 183:421–427. [DOI] [PubMed] [Google Scholar]
- 8.Surace A, Ferrarese A, Marola S, et al. Endorectal ultrasound in the diagnosis of rectal cancer: accuracy and criticies. Int J Surg 2014; 12 (suppl 2):S99–S102. [DOI] [PubMed] [Google Scholar]
- 9.Al-Sukhni E, Milot L, Fruitman M, et al. Diagnostic accuracy of MRI for assessment of T category, lymph node metastases, and circumferential resection margin involvement in patients with rectal cancer: a systematic review and meta-analysis. Ann Surg Oncol 2012; 19:2212–2223. [DOI] [PubMed] [Google Scholar]
- 10.vander Paardt MP, Zagers MB, Beets-Tan RG, et al. Patients who undergo preoperative chemoradiotherapy for locally advanced rectal cancer restaged by using diagnostic MR imaging: a systematic review and meta-analysis. Radiology 2013; 269:101–112. [DOI] [PubMed] [Google Scholar]
- 11.Whiting PF, Rutjes AWS, Westwood ME, et al. The QUADAS-2 Group. QUADAS-2: a revised tool for the quality assessment of diagnostic accuracy studies. Ann Intern Med 2011; 155:529–536. [DOI] [PubMed] [Google Scholar]
- 12.Rutter CM, Gatsonis CA. A hierarchical regression approach to meta-analysis of diagnostic test accuracy evaluations. Stat Med 2001; 20:2865–2884. [DOI] [PubMed] [Google Scholar]
- 13.Deeks JJ, Macaskill P, Irwig L. The performance of tests of publication bias and other sample size effects in systematic reviews of diagnostic test accuracy was assessed. J Clin Epidemiol 2005; 58:882–893. [DOI] [PubMed] [Google Scholar]
- 14.Merkle EM, Dale BM, Paulson EK. Abdominal MR imaging at 3 T. Magn Reson Imaging Clin N Am 2006; 14:17–26. [DOI] [PubMed] [Google Scholar]
Associated Data
This section collects any data citations, data availability statements, or supplementary materials included in this article.


