
Figure 3.
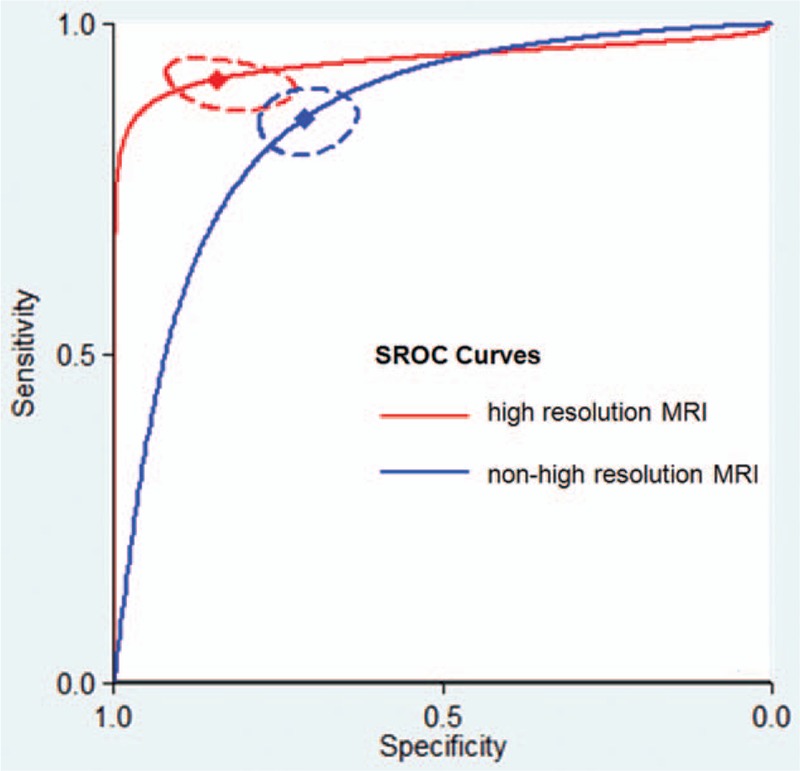
Summary receiver operating characteristic (SROC) curves comparing the diagnostic accuracy of high-resolution magnetic resonance imaging (MRI) and nonhigh-resolution MRI for T-staging in rectal cancer patients. The red diamond represents the summary operating point for high-resolution MRI. The blue diamond represents the summary operating point for nonhigh-resolution MRI. The dotted red and blue lines represent the corresponding 95% confidence intervals. Sensitivity is shown on the y-axis, and specificity on the x-axis. The solid red and blue lines represent the SROC curves.