
Figure 5.
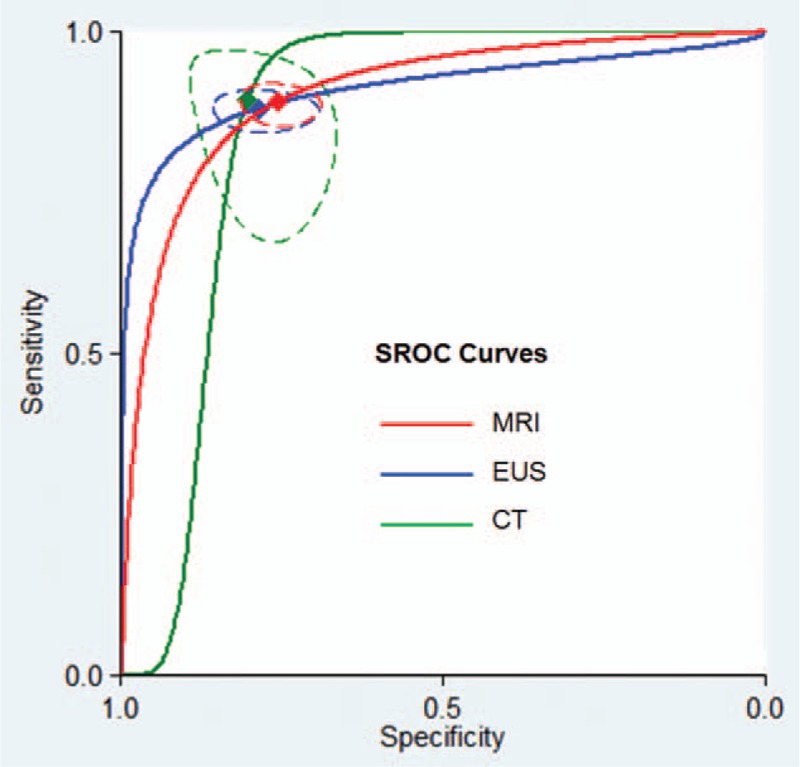
Summary receiver operating characteristic (SROC) curves comparing the diagnostic accuracy of the magnetic resonance imaging (MRI), computed tomography (CT), and endoluminal ultrasound (EUS) for T-staging in rectal cancer patients. The red diamond represents the summary operating point for MRI. The blue diamond represents the summary operating point for EUS. The green diamond represents the summary operating point for CT. The dotted lines represent the corresponding 95% confidence intervals. Sensitivity is shown on the y-axis, specificity on the x-axis. The solid lines represent the SROC curves.