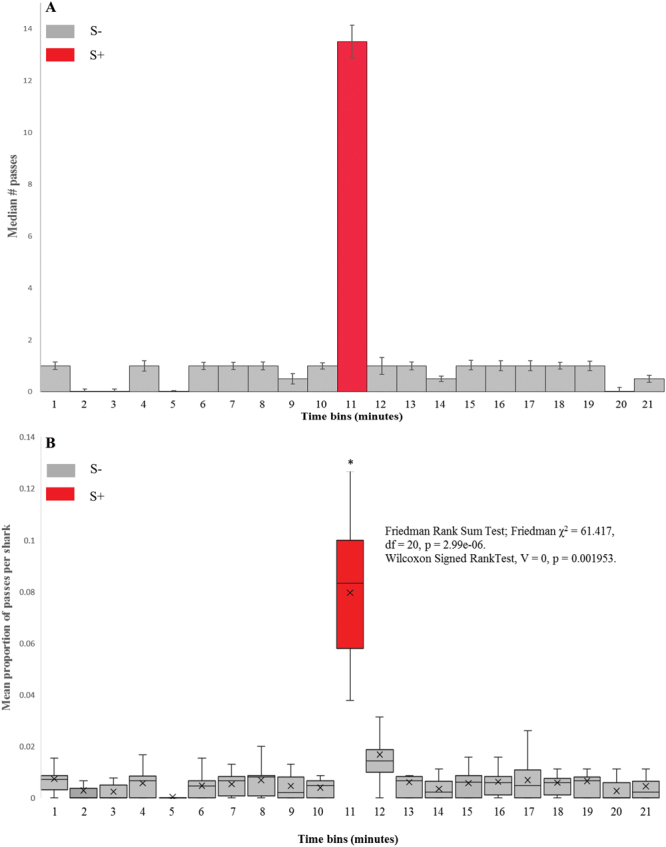
Figure 1.

Behavioural responses of unimpaired sharks to presented magnetic stimulus. (A) Histogram showing median number of passes over the target for all sharks, in each 1 minute time bin. S+ minute is shaded red, all other 1 minute time bins (S−) are shaded grey. Error bars show standard error. (B) Box & Whisker plot showing mean proportion of passes over the target, per shark, across the series of ten unimpaired trials, mean value is denoted by x. S+ minute is shaded red, all other 1 minute time bins (S−) are shaded grey. Friedman Rank Sum tests were used to determine any differences in time bins. Wilcoxon Signed Rank Tests were used to compare mean proportion of passes over the target, averaged per shark in the eleventh minute time bin with each other one minute time bin. Averaged per shark, a significantly higher proportion of passes over the target was seen in the S+ (11th) minute. *p < 0.01.
