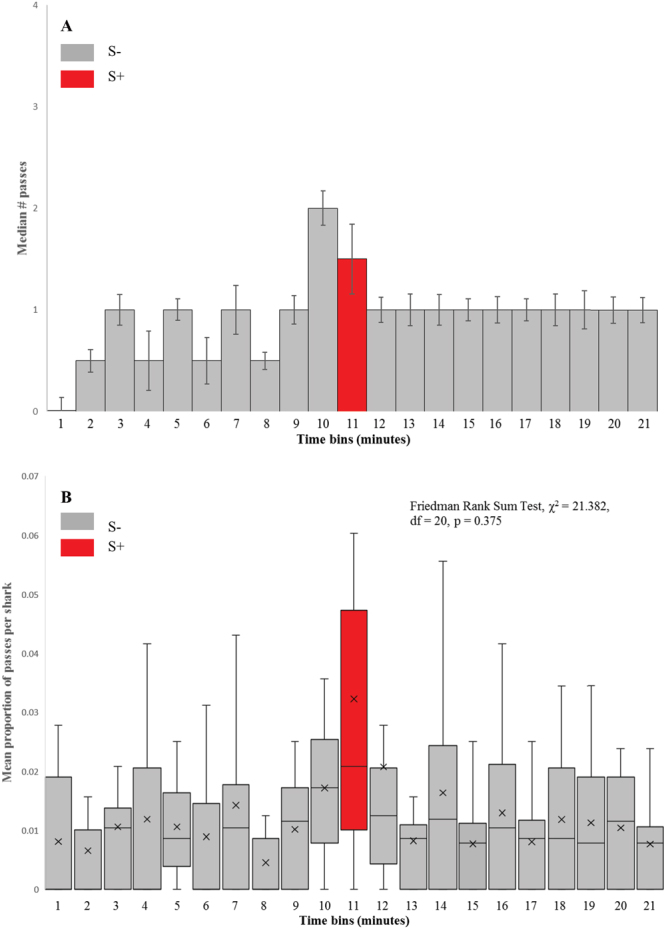
Figure 3.

Behavioural responses of sensory impaired sharks to presented magnetic stimulus. (A) Histogram showing median number of passes over the target for all sharks, in each 1 minute time bin. S+ minute is shaded red. Error bars show standard error. (B) Box & Whisker plot showing mean proportion of passes over the target, averaged per shark, across the series of ten sensory-impaired trials, mean value is denoted by x. S+ minute is shaded red, all other 1 minute time bins (S−) are shaded grey. Friedman Rank Sum tests were used to determine any differences in time bins. No difference was found under S+ or S− conditions when animals had undergone magnetic impairment treatment.
