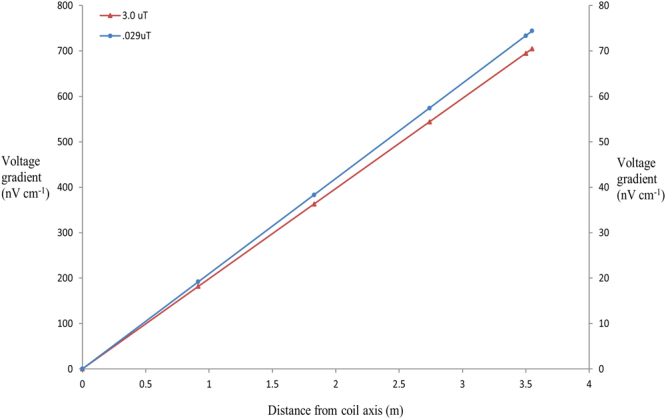
Figure 6.

Calculated induced voltage gradient associated with magnetic stimulus. Modelled gradients correspond to changes in total magnetic field intensity of 3 μT (red line) and 0.029 μT (blue line) respectively. Red line corresponds to Y axis, blue line corresponds to Z (secondary) axis. Voltage gradients induced by modification of the local magnetic field within the tank were calculated from centre (coil axis – 0 m) to periphery (3.5 m) at increments of 3 ft (0.9144 m). Induced voltages increased linearly with distance, peaking at 73.3 nV cm−1 at the tank periphery when a magnetic field modification of 0.029 µT was applied. Calculated time to reach peak induced voltage gradient following onset of magnetic stimulus was 2.7 milliseconds.
