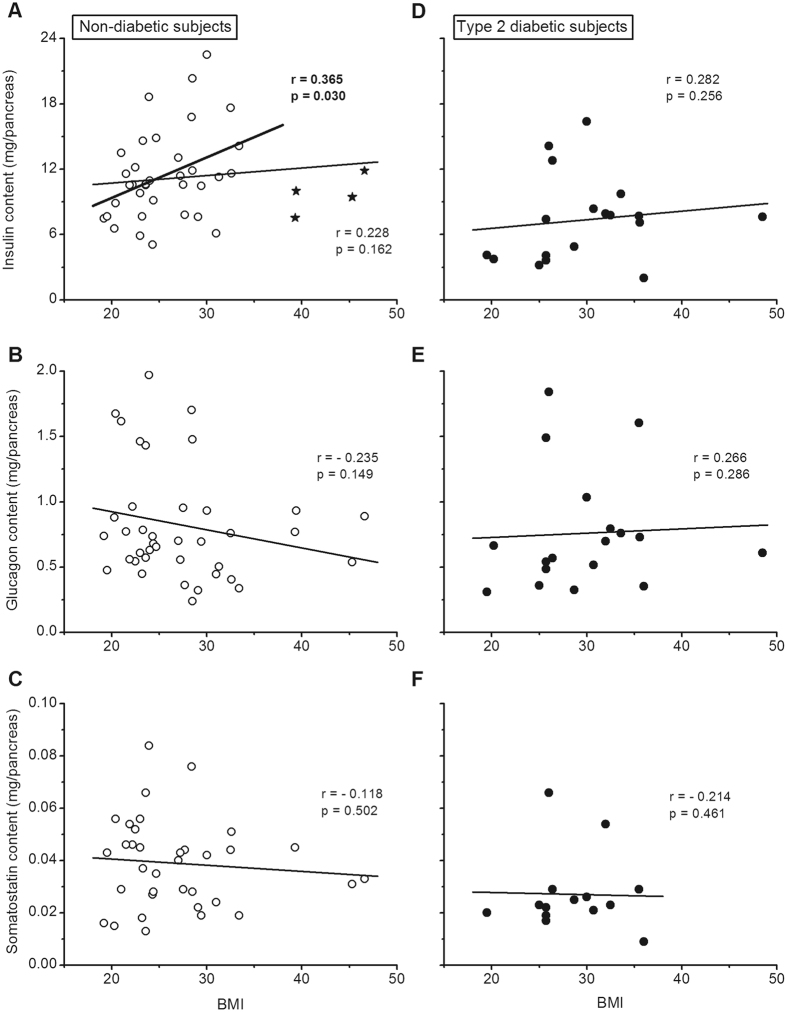
Figure 3.
Correlations between the insulin, glucagon and somatostatin content of the pancreas and the BMI of the subjects. Panels (A–C) show results for non-diabetic subjects. (A) The correlation calculated for all subjects is shown by the thin line. The correlation calculated after exclusion of the 4 subjects with a BMI above 38 (stars) is shown by the thick line. Panels (D–F) show results for type-2 diabetic subjects. Correlation coefficients were calculated by the test of Spearman.

