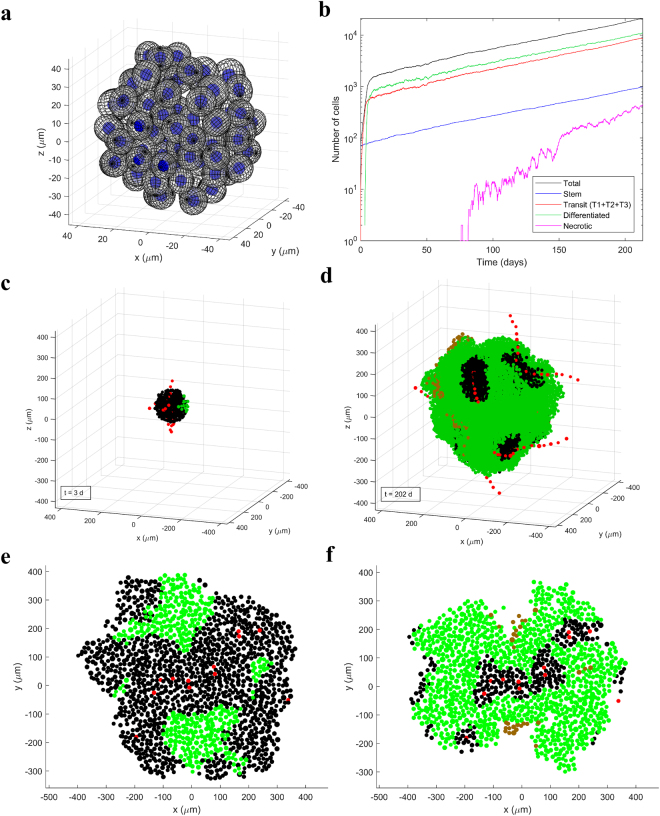
Figure 2.
HNSCC tumor growth model. (a) Tumor cells are modeled as non-overlapping ellipsoids in randomized positions in 3D. (b) Cell kinetics for the different types of cells in an example simulation. (c,d) The tumor in the example simulation after 3 days and 202 days of growth. Vessel units are shown in red, normoxic cells in black, hypoxic cells (pO2 < 10 mmHg) in green and necrotic cells in brown. Vessel units “string” together to form whole vessels that undergo branching in a chaotic fashion. Tumor cells close to vessels are normoxic, cells further from vessels are hypoxic and cells pushed further than ND from a vessel become necrotic. This example simulation started with approximately 70 CSCs and ended with RVV = 0.4%, using p 0 = 40 mmHg, ND = 180 µm and CSC symmetric division probability = 2%. (e,f) Sections of tumors with the same vasculature structure but different blood oxygenation (via p 0 and ND) ((e) p 0 = 60 mmHg and ND = 220 µm; (f) p 0 = 30 mmHg and ND = 120 µm). (e,f) were adapted with permission from ref. 10.

