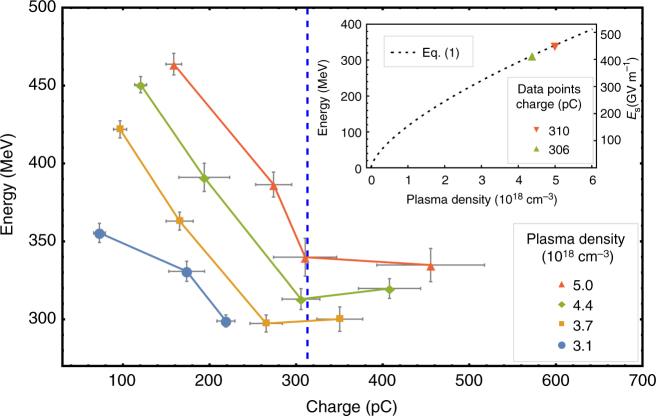
Fig. 2.
Electron energy dependency on both charge and plasma density. Connected data points show a set of equal plasma density, increasing charge with increasing nitrogen doping (see Supplementary Fig. 5). Electron energy is the E max and charge within the FWHM of the energy peak is displayed. The error bars represent the s.e.m. The estimated optimal loaded charge according to Eq. (1) of 313 pC is indicated by the dashed vertical line. The inset shows the predicted acceleration gradient (right axis) according to Eq. (1) (dotted line) for a laser peak power P = 64 TW (equivalent to the experiment) under optimal loading conditions. The left axis shows the predicted electron energy, taking 0.8 mm effective acceleration distance. Data points represent measured data points at the predicted optimum

