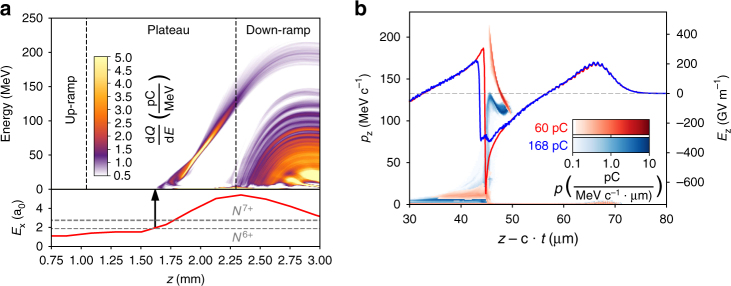
Fig. 4.
Energy evolution and beam loading effects during the acceleration process. Results from PIC simulations. a Energy histogram (top) showing evolution of the electron energy throughout the acceleration process. Final injected charge in the peak is 60 pC. The bottom plot shows the on-axis laser strength evolution with the dotted lines representing the required field for ionization of the two nitrogen K-shell electrons. Additional injection of both helium and nitrogen electrons occurs in the density down-ramp of the gas jet, resulting in a low-energy background in the final energy spectrum. b The effect of beam loading on the accelerating field E z (line graphs, right axis) and electron phase space (color scale, left axis) for 60 pC load in the peak (red) and 168 pC load (blue). Corresponding to z = 2.3 mm in a

